
Dr Hassan Hemida, Reader in Computational Mechanics at BCRRE talks in detail about his latest research on the aerodynamic impact of the RoofRider on a passenger train. Details on this impressive project below!
The world’s premier location for the study of aerodynamic drag on trains is probably the Birmingham Centre for Railway Research and Education located in the UK. As you can see below, the University of Birmingham Campus features stylish architecture. And BCRRE is based in the new School of Engineering and UKRRIN building. I first found out about the BCRRE when I checked out the book “Train Aerodynamics: Fundamentals and Applications” which is the new bible on the subject and written by a number of researchers who teach there.

After reading the book I immediately wanted to see if they would be interested in evaluating the impact of the Roofrider on passenger trains, and they said yes! We (me, Dr. Hassan Hemida, Dr. David Soper and Dr. Syeada Anam Hashmi) now have two exciting academic papers in working status. Moving scale model (a scale model train catapulted down a track at 40 meters per second with pressure sensors installed to measure airflow) and CFD (computational fluid dynamics/ computer simulations) testing was performed on 1/25th scale models to estimate the aerodynamic impact of the RoofRider on a passenger train. If you want the full details you will need to wait on the papers, but here is a short summary for the lay reader.
The RoofRider is a short deflector (less than an inch in height) installed on the rooftop edge between railcars that looks a bit like a car spoiler to reduce drag from the inter-car gap. Below you can see the current design in green attached to yellow ICE2 railcars in a screenshot from the CAD design used for CFD testing. The device is tiny, it’s limited to less than 0.82 inches in height due to clearance rules on some rail lines, but it can have a big impact by gently pushing air over the inter-car gap instead of letting it strike the front face of the following car. That is an oversimplification of what we found, but I’ll explain more later. The RoofRider is installed on both sides of the gap as the train can travel in either direction.
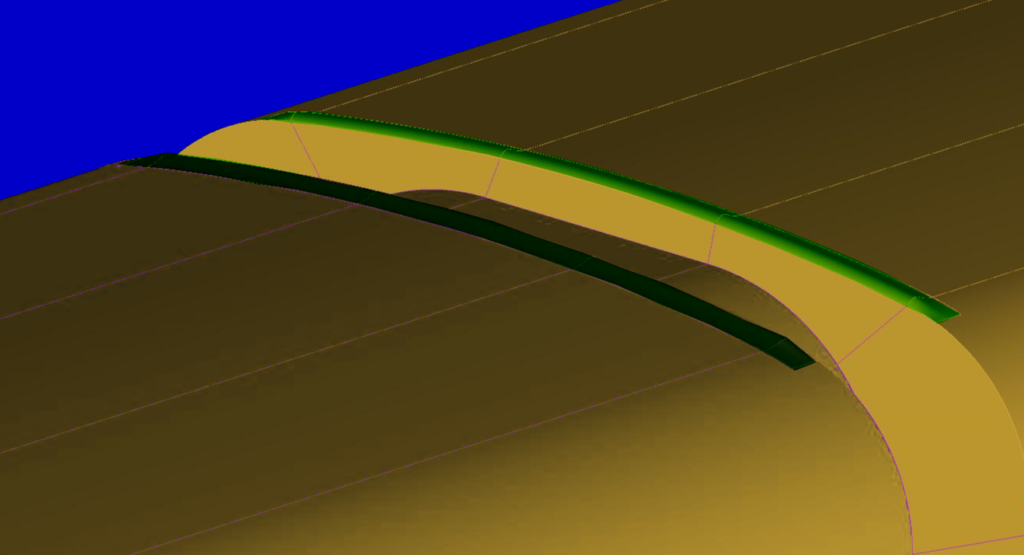
Dr. Hassan Hemida and Dr. David Soper started testing with a 1 inch deflector that had a triangular cross section, originally designed for used on Intermodal freight trains (double stacked trains carrying containers.) We then moved on to the 0.72 inch tall curved RoofRider you can see above which performed better during testing and fits under the 0.82 inch rule. Tapered sides improve performance in crosswinds.
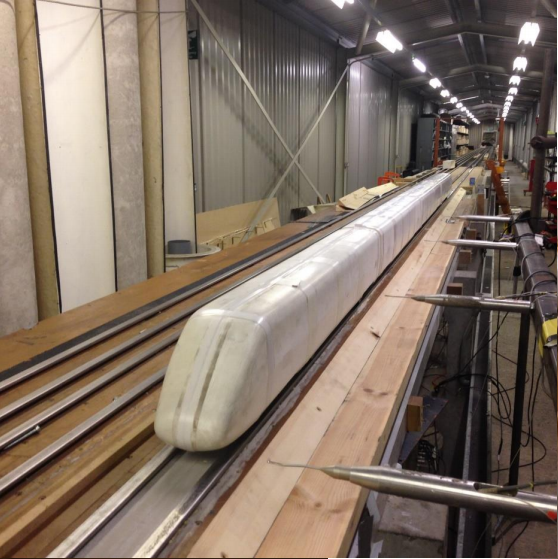
Moving scale model testing was done at the TRAIN (TRansient Aerodynamic INvestigation) Rig, a 150 meter long track which model vehicles can be catapulted down at speeds of up to 80 m/s. Don’t try that at your home train set Railfans! It also has a tunnel section for modeling tunnel aerodynamics, and a crosswinds section with a wall of fans for modeling what can happen to a train on windy days. You can find more information along with a video of it in operation here. An ICE2 model with and without deflectors attached near the inter-car gap was sent down the track repeatedly, and pressure sensors on the nose, side and inter-car gap of the first car were used to determine the accuracy of CFD modeling and to see if there was any reduction in pressure within the inter-car gap. The other form of physical scale model testing which is often done is wind tunnel testing, which is what we did when testing the RoofRider on Intermodal trains. The big advantage of the TRAIN Rig over a wind tunnel is that it captures the impact of a moving ground, the difference in speed between the train and the ground leads to an increase in drag on the underside of the train which wind tunnels won’t capture.
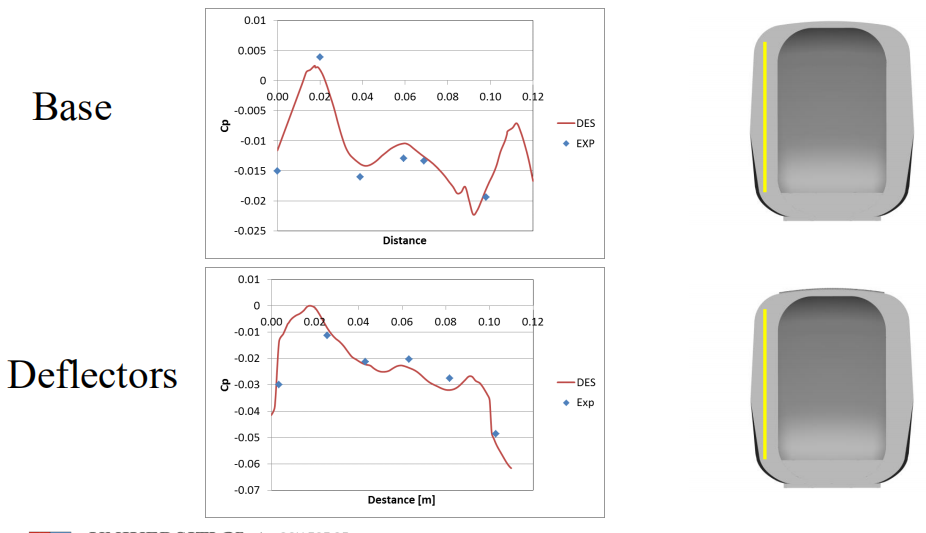
Below you can see results comparing pressure values from the TRAIN Rig (blue dots) and CFD testing (red line) for the Inter-car gap. Detached Eddy Simulation (DES) was the specific method of CFD modeling used in this case, DES is a very computationally intensive form of CFD modeling compared to alternatives like RANS, but does a much better job accounting for turbulence, which is extremely important in this case as eddies form in the inter-car gap area. You can see below that the DES results matched up very well with those from the TRAIN Rig, and overall there was also a large drop in surface pressure with the inter-car gap. This shows that the RoofRider is successfully deflecting air away from the inter-car gap.
Below you can see results comparing pressure values from the TRAIN Rig (blue dots) and CFD testing (red line) for the Inter-car gap. Detached Eddy Simulation (DES) was the specific method of CFD modeling used in this case, DES is a very computationally intensive form of CFD modeling compared to alternatives like RANS, but does a much better job accounting for turbulence, which is extremely important in this case as eddies form in the inter-car gap area. You can see below that the DES results matched up very well with those from the TRAIN Rig, and overall there was also a large drop in surface pressure with the inter-car gap. This shows that the RoofRider is successfully deflecting air away from the inter-car gap.
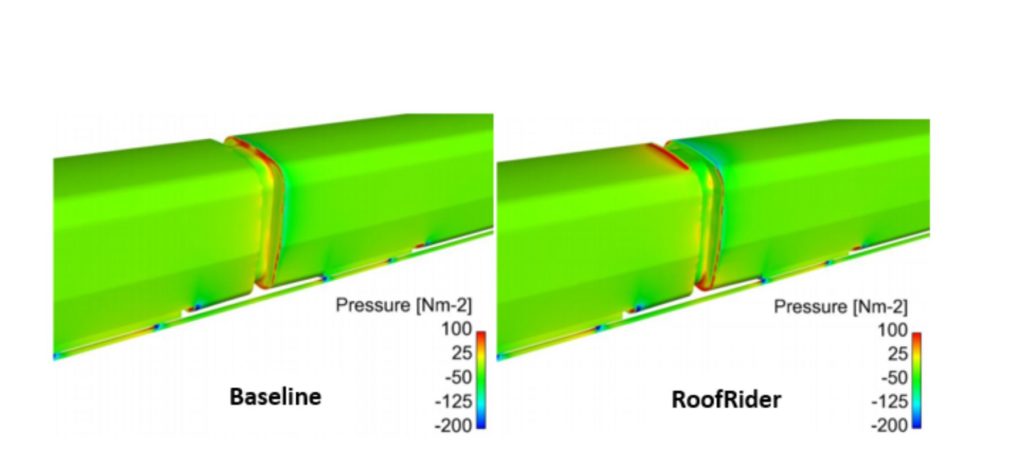
A visualization of the surface pressures from DES testing shows the impact of the deflectors in a fairly dramatic way. The front edge of the second car goes from bright red in the first image to light blue in the second, this reduced pressure on the front face of the second car means less force from air pushing back against the train and energy savings. There are some countervailing impacts, pressure drag is slightly increased on the RoofRider itself and if you look closely at the bottom of the gap the red area is slightly larger due to more air entering the gap from the undercarriage. This also illustrates the importance of modeling a moving ground even when looking at rooftop modifications. Overall however the reduction in pressure drag from the top of the second car has a much larger impact, and aerodynamically drag for the train as a whole is substantially reduced by 4.3% in headwinds and 5.5% at 10° yaw according to DES results with the current best iteration of the RoofRider design.
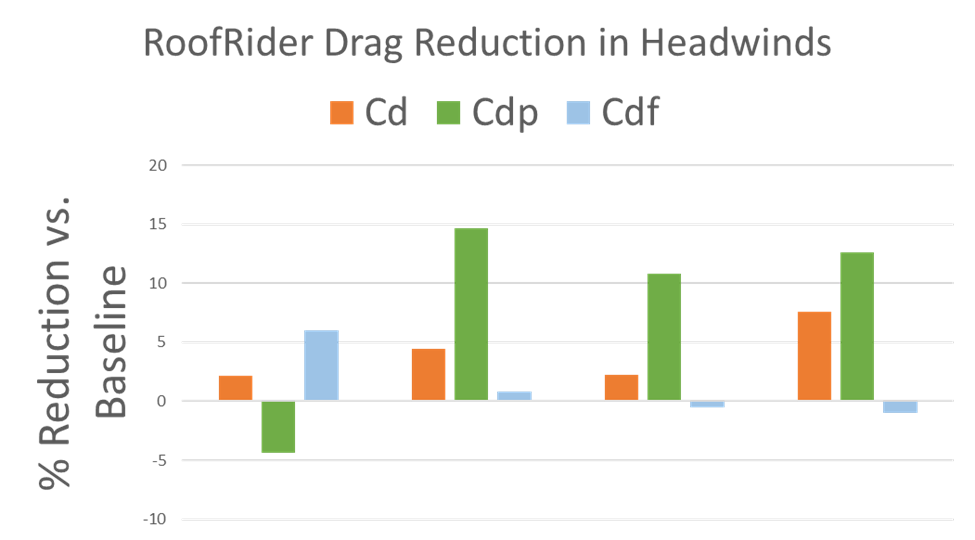
Some surprises are in store when looking at the impact on drag by car. The graphic below shows the % change in Cd (coefficient of drag/ amount of drag resistance standardizing for frontal surface area, pressure and velocity), Cdp (the portion of Cd that is due to differences in air pressure at different regions of the train) and Cdf (the portion of Cd that is due to skin friction) for each car in the no headwinds case. Before testing I only expected to see reductions in drag on cars 2 through 4 from a reduction in Cdp for those trailing cars. We did see that reduction in drag, but there was also an additional reduction in drag on the lead Car 1 due to a drop in skin friction. We have some hypothesis for why we saw this reduction in skin friction on the lead car, but I won’t mention them here because we need to leave some cliffhangers for the academic papers.
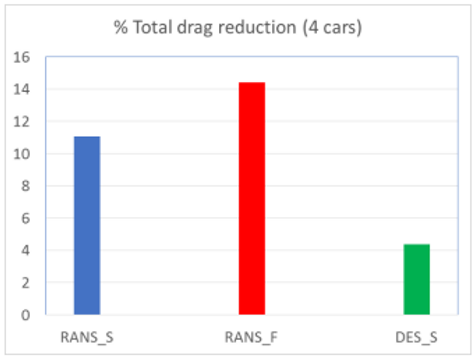
Too make sure that the smaller size of the scale model wasn’t causing any issues, we also ran two RANS CFD simulations at model (RANS_S) and full scale (RANS_F) to check for robustness. Running a DES full scale model would not have been computationally practical. Both RANS models gave much higher estimates for drag reduction from the RoofRider in headwinds than DES, but only the DES model should be used for savings estimates due to its higher accuracy. The RANS results are only important for showing that going from model to full scale is unlikely to hurt savings, the reduction in drag was a bit higher at full scale with RANS at ~14% vs ~11% at small scale.
So how much of a reduction in energy consumption should passenger railroads see from a 4.3-5.5% reduction in aerodynamic drag without and with crosswinds? The numbers will probably differ quite a bit between trains and routes, with the highest savings on faster trains in windy areas that don’t make a lot of stops. A general rule from the book “Train Aerodynamics” is to assume a ratio of 0.3 between reductions in drag and energy on low speed trains and 0.5 on high speed trains; the 0.3 number matches my experience with slower freight trains. This suggests passenger trains with the RoofRider installed will probably see a reduction in energy consumption from 1.3-2.75%. These are exciting numbers, as an example a 1.5% reduction in traction energy consumption for the UK rail sector in 2019 alone would have meant ~36,000 fewer tons of carbon released!
