
A newly released LPIP report by Matt Lyons (City-REDI) and Stephen Brand (New Horizon Economics) examines how UK regions’ GVA is becoming decoupled from energy inputs and emissions. This blog summarises the report in 4 key points.
1- The UK is decoupling at the national level
The amount of energy and emissions required to generate Gross Value Added (GVA) has fallen significantly. Some key figures upfront on what has changed between 2015 and 2023:
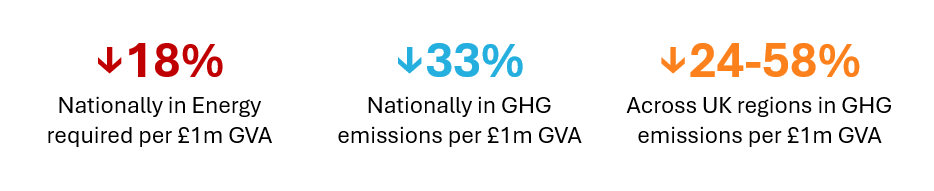
Figure 1 shows that the amount of energy required to produce £1m of GVA has fallen steadily from 2015 down -18% by 2023. A small blip occurs during the peak year of the COVID-19 pandemic, likely driven by a decline in economic output resulting from lockdown restrictions.
It also shows that Total GHG emissions required to generate £1m of GVA in the UK have fallen 33% between 2015 and 2023. The emissions are further broken down into the separate gases of concern: Carbon Dioxide (CO2), Methane (CH4), and Nitrous Oxide (N2O). The figure shows that CO2 has experienced the largest decline over the period 2015-2023 (37%). CH4 has also seen a marked decline (32%), and the decline in N20 has been much steadier (-17%).
Figure 1. % change in energy and emissions by type per £1m GVA 2015-2023
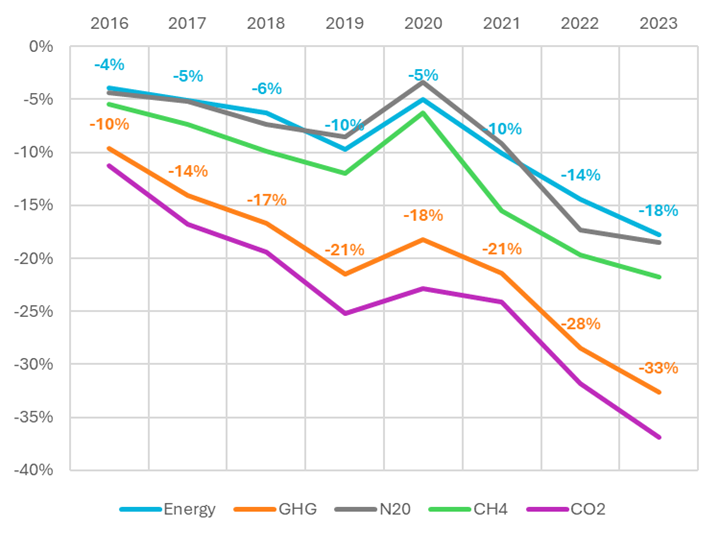
Energy measured by kilo tonnes of Oil Equivalent (KTOE)
GHG, N20, CH4 and CO2 measured by kilo tonnes of carbon dioxide equivalent (KT CO2E)
Source: New Horizon Economics
2 – All UK regions are becoming more energy and emissions efficient – but at different speeds
Figure 2 shows how the amount of energy required to produce £1m in GVA has changed between 2015 and 2023 by region. The darker blue areas indicate relatively higher energy intensities, and lighter blue areas lower energy intensities. The maps reveal decoupling of energy use from GVA generation, although this trend varies significantly across regions.
Figure 2. Energy Input KTOE* per £1m GVA by ITL- 1 region
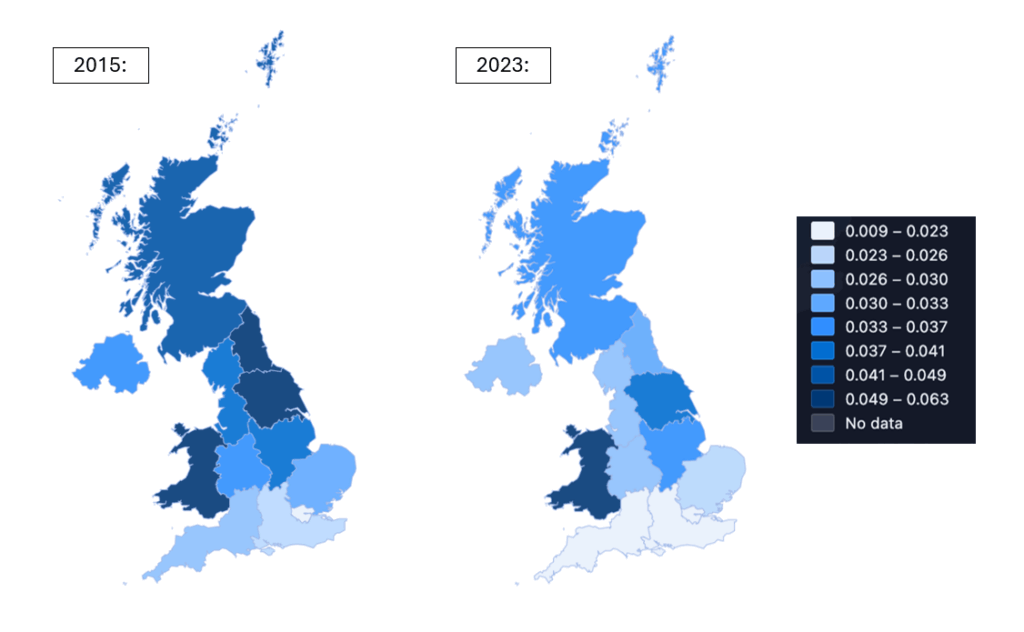
Figure 3 shows the change in emissions between 2015 and 2023 by region. Once again, a similar pattern is observed with all regions reducing their emissions intensity over this time period, reflecting the UK’s national commitments to decarbonisation and net zero.
However, these reductions are not solely driven by changes in overall energy consumption but are impacted by differences in the industrial structure of regions. Sectors that are more reliant on electricity, such as services, have experienced faster declines in emissions intensity due to the decarbonisation of national electricity generation rather than region-specific mitigation efforts. Regions with a higher concentration of energy-intensive industries, especially those dependent on high-temperature process and/or direct fossil fuel use (e.g. ceramics, steel industries), are more difficult to decarbonise. This helps to explain why regions such as Wales, the East Midlands and the North East of England continue to have relatively high emissions intensities (indicated by the darker shading).
Figure 3. Change in GHG emissions (KT CO2E) per £1m GVA by ITL-1 region (2015-2023)
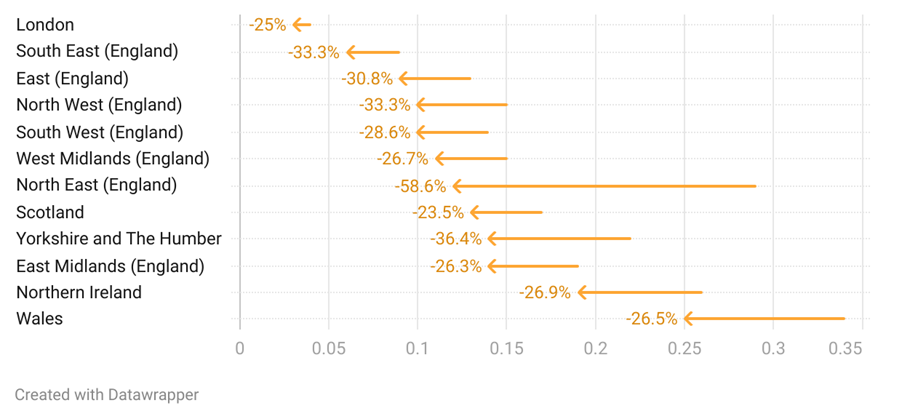
axis shows KT CO2E) per £1m GVA
Source: New Horizon Economics
3 – Sub-regional economic structures matter
The regional level provides more context to the national figures; however, even within regions, there can be significant heterogeneity when it comes to economic structure and the resulting emissions. The West Midlands is an interesting case study region as it has a mix of rural agricultural sub-regions, metropolitan areas with clusters of high-end services and industrial areas home to advanced manufacturing clusters.
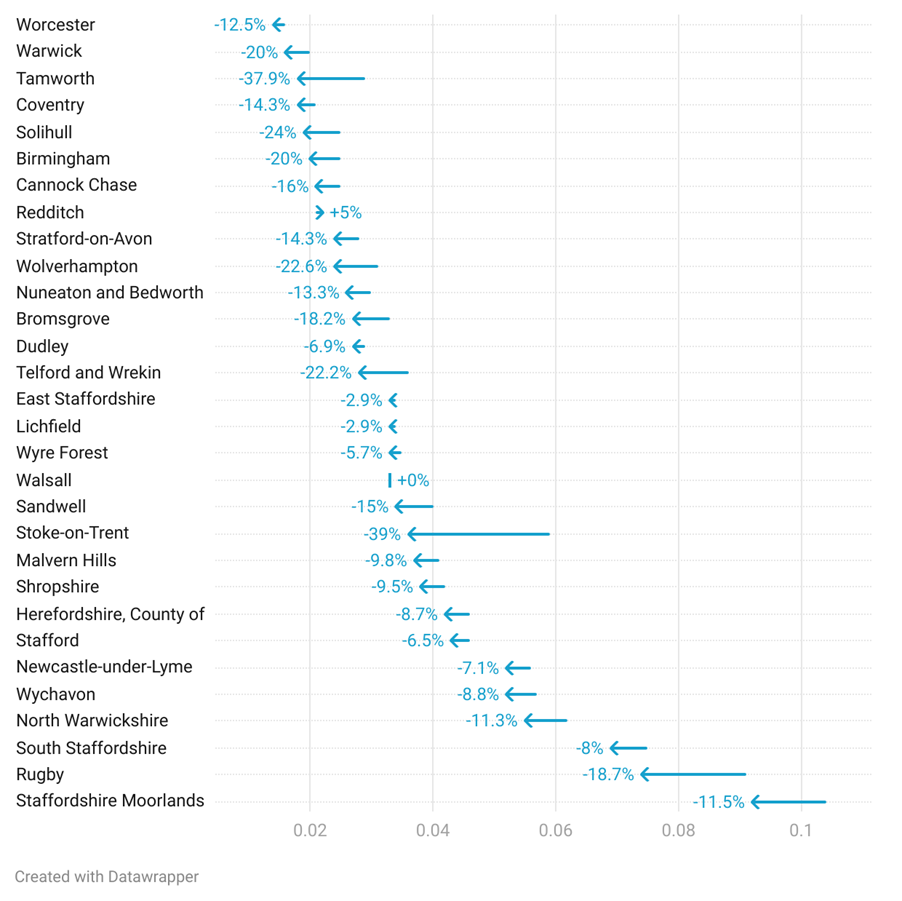
Figure 4 shows the change in energy inputs to produce £1m in GVA at the Local Authority level within the West Midlands region. The figure reveals that energy inputs required to generate £1 million in GVA vary significantly within a single region.
Some Local Authority Districts started from high-energy baselines due to their sectoral mix, including industries like ceramics, automotive manufacturing and advanced engineering. Key examples beingStoke-on-Trent home to ‘The Potteries’ (−39%), Tamworth (−37.9%), and Telford & Wrekin home to aluminium casting and automotive and defence firms (−22.2%). In these cases, it may be that efficiency improvements and technology adoption is driving relatively large percentage reductions.
Service-oriented economies such as Solihull (−24%) and Birmingham (−20%) that host financial and business services clusters consume less energy per unit of output and may have benefitted from digitisation and growing productivity. Some Local Authorities show little change, Redditch (+5%) and Walsall (+0%). This may be due to the reliance on light manufacturing and logistics and limited structural change.
Figure 4. Change in Energy Input (KTOE) per £1m GVA by LA in the West Midlands (2015-2023)
Source: New Horizon Economics
4 – Place-based approaches and monitoring and evaluation are key to effective policy design
The national level data indicates that there is significant decoupling of emissions from economic output. This suggests that economic growth need not be traded for a reduction in emissions. The environment/economic trade-off has been investigated in a previous LPIP paper, ‘Balancing the economic and environmental impacts of net zero’ (Lyons, 2025). This paper goes some way to consider how reductions in the activity of different high-emissions industrial sectors might impact the economy and progress towards net zero.
Beneath this national progress, however, persistent regional differences remain. Some regions continue to require more carbon per unit of output in part due to their industrial composition. The divergence between high-value service sector regions and more manufacturing-based regions shows a central challenge for the UK’s net zero transition. It begs the question:
“How can net zero be achieved without deepening regional inequalities?”
A just transition must be spatial as well as sectoral, a concept of ‘regional just transition’ that has been explored in two other LPIP blogs: ‘Making Sense of Just Transition in City and Regional Policy-Making’reporting the analysis in Eadson, et al., (2025) and ‘Governing for Net zero?’ reporting the work of (The British Academy, 2025).
The findings of this report underscore the importance of regional metrics for effective policy design. The report also makes it clear that a ‘one size fits all approach’ will not be sufficient. Pathways to net zero must reflect local economic structures, energy systems and institutional capacities. However, regional differentiation also presents an opportunity to learn from the outliers and study more closely what is driving regional changes in progress towards decarbonisation.
This blog was written by Dr Matt Lyons, Research Fellow, City-REDI, University of Birmingham and the lead for Living and Working Sustainably in a Greener Economy, LPIP Hub.
Disclaimer:
The views expressed in this analysis post are those of the author and not necessarily those of City-REDI or the University of Birmingham.