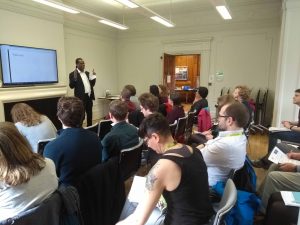
 We welcomed a sell-out crowd to our fourth Digital Research Conversation on Tuesday 9th April, to discuss ‘Making Sense of your Data’. After some networking whilst munching on pizza and brownies, it was onto the talks and Nina Vyas from the Dental School introduced us to the use of machine learning for analysing microscopy images. Nina investigates biofilms containing bacteria which are present on dental implants and finds it difficult to split regions of the images into background or biofilm when using SEM (Scanning Electron Microscopy), as the contrast between the two is not good.
By using Trainable Weka Segmentation which is free, open-source software (can be used in Image J or Fiji), the features in an initial input image are manually annotated to train a classifier set and then segment the other images accordingly into biofilm or background. The GUI (Graphical User Interface) makes it easy to use without any programming experience.
Laurence Hurst from the BEAR Software team then talked about the next stage in machine learning, deep learning, which has come about through the increased compute power available since the 2010s. Laurence discussed the importance of data for deep learning, an example of deep learning in practice is when Alexa asks ‘Did I do what you want’? She then takes the feedback and trains herself for future questions. Data needs to be classified e.g. labelling an image as dog or cat, but it is 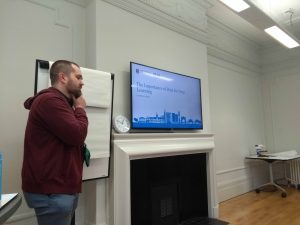 important to use a wide range of data to train e.g. home assistants need to hear Scottish voices to be able to understand them! Existing data sets can be used for training but we need to be careful of data ownership and recognising the rights of those in the images/data. If you’re interested in attending the NVIDIA Deep Learning course that Laurence teaches, upcoming dates are posted here. A new BEAR AI service, based on IBM POWER9 will be launched later this spring, contact us at bearinfo@contacts.bham.ac.uk if you’re interested in using it.
Moving on from deep learning, Neil Winkles (Senior Systems Developer, Birmingham Clinical Trials Unit) then gave us some tips on how to anonymise personal data to allow data sharing (where permitted!). At the start of a project, it is important to incorporate privacy by design. Some top tips were:
- Do you need to collect identifying information? If so, structure your data so
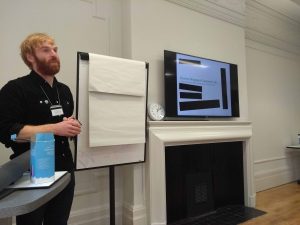 they are separate.
 - Don’t collect more than you need for your study e.g. collect age rather than DOB.
- Avoid free text boxes.
- Rare outliers make data identifiable so group data into bands e.g. age, height.
- Change the order of data – it may be in the order collected so that could make it identifiable if the dates of collection are known e.g. hospital recruitment trips.
Automated anonymisation is possible through tools incorporated into REDCap and other software. Some tools used by the UK Data Service are available here including an add-on for MS Word which anonymises qualitative data. Finally, make sure you have permission to share the data!
Viola Wiegand then introduced us to the type of data that she analyses – data harvested from the Times Digital Archive (TDA). She analyses the language used throughout history to look for recurrent patterns and the TDA provides a supply of news articles from 1785 through to 2013 (currently) – available through Find It@Bham.
However, the TDA provides no full text from the interface, just the scanned article which is of varying quality.
Their research team has a copy of the full text and has been processing it to remove unnecessary XML tags with the support of the BEAR Software group in order to create an online interface for quick searching. Viola is then able to search the text (including adverts) to find the frequency of words and how it changes over time. Her particular field of interest is in how often surveillance, privacy and CCTV are mentioned, e.g. when Princess Diana died in 1997, there was a peak in use of the word ‘privacy’.
From the study of language to particle physics, Nicolas Lurkin then discussed the massive amounts of data they generate through the NA62 experiment at CERN. The NA62 experiment counts as a ‘medium-sized’ experiment for CERN with only 200 collaborators! Data from the different particles are collected through cameras and then used to reconstruct particle collisions.
If they were to photograph every event they would have 100 thousand billion photos to store per year! They therefore have to use triggers to reduce the number of photos taken, which only select ‘interesting’ events. They discovered a new particle using only 500 photos per year. They have different teams dedicated to data analysis which perform event filtering to further reduce the amount of data. Even so, CERN has 250PB of data, creating 75PB per year! To put this into context our new research Data Centre ‘only’ holds 3PB! CERN also uses ~200K computing cores for processing. Particle Physics is another area making use of machine learning with the techniques used at all stages of the experiment: trigger, reconstructions and the final analysis.
 To conclude, we had five very interesting and diverse talks which were readily accessible to the mixed-discipline audience. Earl Joseph will be leading the next DRC which is due to be on ‘data visualisation’ so keep an eye on twitter or email us at bearinfo@contacts.bham.ac.uk to be added to our mailing list.
Further Information
University of Birmingham researchers can sign up to our Digital Research Conversations Canvas course to find slides and summaries of our series of DRC events: https://canvas.bham.ac.uk/enroll/Y7C7LY