 Dr Maryna Ramcharan discusses her new report examining income inequality in the UK at a regional level with a particular focus on the West Midlands.
Visit the project page and view the report – Income Inequality, Policies and Inclusive Growth
The UK has a very high level of income inequality compared to other countries. Income inequality is entrenched across genders, ages, ethnicities, and regions, being accumulated during individuals’ lifetimes and inherited by the next generation. Income inequality lies in the heart of many current problems and policies which society is focused on e.g., gender disparities, inclusive growth, social mobility, inequality in opportunities, and has complex relationships and strong associations with many other issues like health inequalities, poverty and unemployment.
This report examines income inequality in the UK at a regional level with a particular focus on West Midlands. This includes analysis of main metrics of income inequality at the regional level, distribution of income across population percentiles in the West Midlands and initial approaches to understanding the drivers behind income inequality. The main metrics of income inequality throughout the report are calculated using annual gross income at the individual level.
Methodology and limitations
The findings of this analysis have to be seen in the light of some limitations.
The first limitation is that the analysis is based on The Survey of Personal Incomes (SPI) 2016-17 and partially 2017-18 (the most up-to-date available at the time of writing) which is based on information held by Her Majesty’s Revenue and Customs (HMRC) on individuals who could be liable to UK income tax. However, not all individuals sampled are taxpayers because the operation of personal reliefs and allowances may remove them from liability.
Where income exceeds the threshold for the operation of PAYE (that is, £11,500 for 2017 to 2018), the SPI provides the most comprehensive and accurate official source of data on personal incomes. However, as HMRC does not hold information for all people with personal incomes below this level, the SPI is not a representative data source for this part of the population and no attempt has been made to estimate the number of cases below the tax threshold or the amount of the incomes.
The second limitation is that SPI provides a rather limited number of individuals’ characteristics and do not necessarily allow an analysis of all social groups of interest. Thus, it does not have data on individuals’ marital status, ethnicity, household composition, types of tenure and other kinds of valuable information.
The third limitation is that due to the intricacy of links around income inequality and the dynamic interdependency, which is hard to define, this report is focused on key dimensions only and so will not cover all the relevant factors due to the complexity involved.
Key findings
The distribution of gross income in the West Midlands is highly unequal. 72% of people have a total income below the regional average: 7 out of 10 are below the average of £23,200 (the national average is £24,400).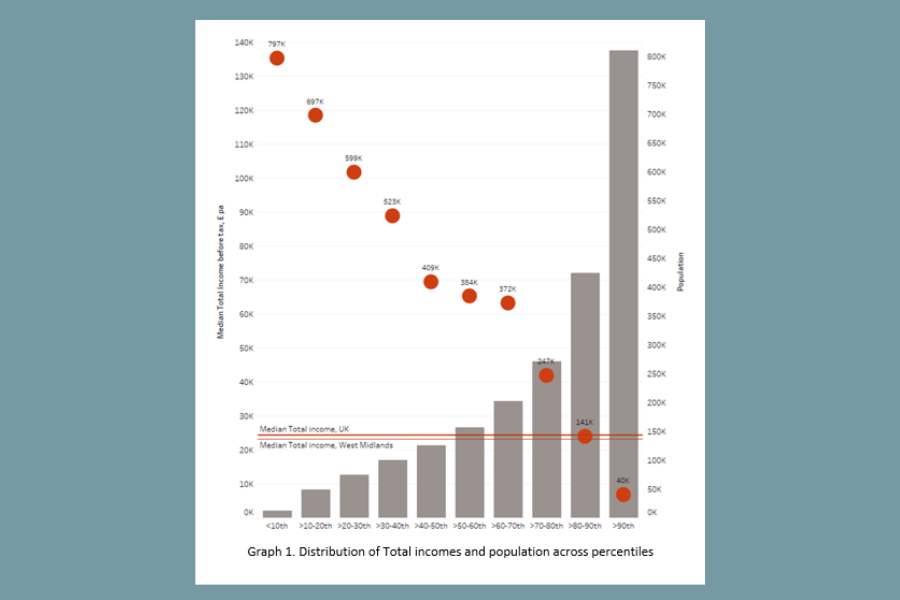
The West Midlands is the 5th most unequal region measured by the GINI index following London, South East, East of England and Scotland.
Median gross income ranges from £2,035 per annum at the bottom 10% of individuals, to £137,430 per annum at the top 10%. Higher incomes tend to be accompanied by higher inequality and bigger gender pay disparity.
Human health and social work activities, Education and Wholesale and retail trade are the top three industries for female employment in the West Midlands.
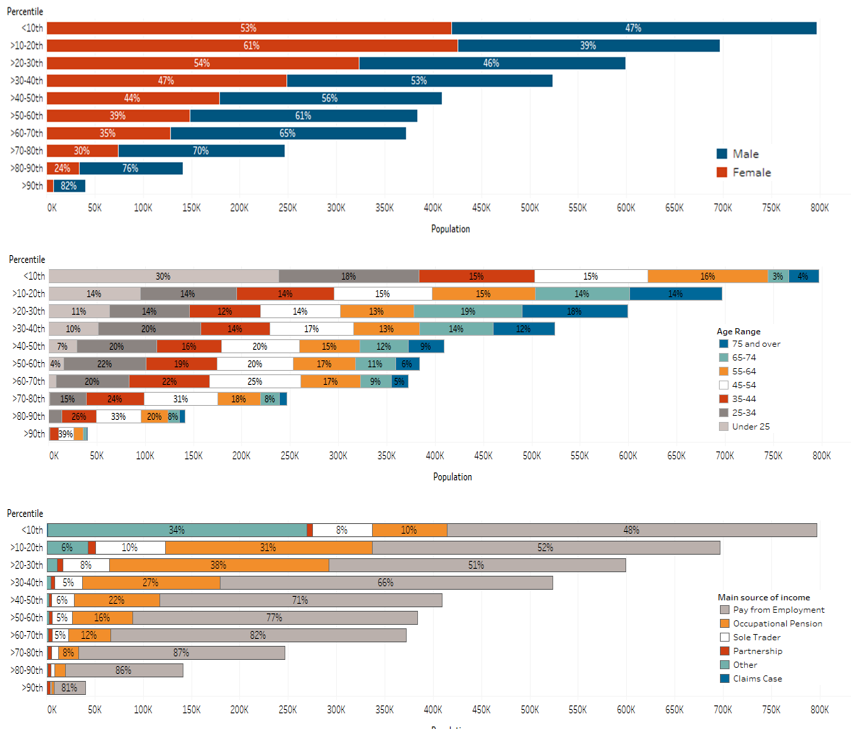
Men are wealthier than women, but at lower incomes, there is greater equality. Disparity happens at the higher income where 8 out of 10 of the richest people are men. But there is more inequality within the income of men than between genders and inequality between males contributes more to the overall inequality.
People get richer in their middle age and the older people are the more unequal the incomes. But this divergence is set early in life and continues to diverge, suggesting the other income is set by inheritance or differences in individuals’ backgrounds early on. Middle-age inequality contributes most to the overall age element of income inequality.
Employment is the main source of income, but for the richest, it is other sources of income (financial investments, property and dividends), that makes them rich. Older people rely mainly on occupational pensions as their main source of income.
Poorer areas have less inequality and richer areas are more unequal, skewed by very high outliers. Kenilworth and Southam, Stratford on Avon, Bromsgrove, Sutton Coldfield, Warwick and Leamington are the top 5 unequal Parliamentary constituencies in West Midlands where high values of income are accompanied by high inequality.
The sector which people work in is the largest of the four dimensions – source, gender, age, and industry – in terms of the contribution to inequality, with significant inequality within the sectors as well. High employment sectors contribute most to inequality, but some sectors have significant within-sector disparity, often ones dominated by sole traders and entrepreneurs.
Income inequalities have been worsening during the current Covid 19 crisis. Two-thirds of the occupations most affected by lockdowns earn lower wages and those occupations that were best suited for homeworking are typically on higher wages. It means that those who are on lower-income have been hit harder. This will increase existing income inequalities, worsening the current highly skewed pattern of income distribution.
Conclusions
Differences between individuals within each social group – Genders, Age, Main Source of Income, and Sector of Employment – are much greater than differences between social groups, no matter how they were classified. There is scope for skills policy to address some of the issues that particular individuals face. But the scale and entrenched nature of the inequalities highlighted in the analyses highlight the fundamental importance of addressing structural variations that are manifest in place, with labour markets and housing markets sorting individuals into particular regions and local areas. This means that policy needs to tackle demand-side issues relating to the nature of jobs, other opportunities and access to services that underlie some places being worse off than others.
Since most people rely on pay income as their main source of income and it is pay income inequality contributing most to overall inequality, reducing inequality here can go a long way in reducing overall inequality.
Individuals, especially females, who are employed in the most unequal sectors crosscutting with the sectors hit hardest by Covid 19 are particularly disadvantaged in the current crisis and may particularly struggle to recover. These sectors include:
- Arts, Entertainment and Recreation
- Accommodation and Food Service Activities,
- Administrative and Support Services Activities,
- Human Health and Social Work Activities, and
- Wholesale and Retail Trade; Repair of Motor Vehicles and Motorcycles.
This blog was written by Dr Maryna Ramcharan from the West Midlands Combined Authority.
Disclaimer:
The opinions presented here belong to the author rather than the University of Birmingham.