The latest edition of REDI-Updates is out now - providing expert data insights and clear policy guidance.

In this edition, the WMREDI team investigates what factors are contributing to the cost-of-living crisis and the impact it is having on households, businesses, public services and the third sector.

The cost-of-living crisis has been felt keenly in the UK. But what about the rest of the world? Kostas Kollydas and Paul Vallance investigate.

View REDI-Updates.
Inflation Growth Rates
The cost of living is influenced by a range of factors, including housing, food, healthcare, transportation costs, taxes, and geographical location. To compare living costs across countries and calculate inflation rates, the Consumer Price Index (CPI) growth rate is often used.
Since the start of 2021, the majority of OECD countries have experienced an upsurge in their total inflation growth rate, which includes food and energy costs, as illustrated in Figure 1. In the UK, the annual inflation growth rate increased significantly by 8.6 percentage points, from 0.8% in the fourth quarter of 2020 to 9.4% in the fourth quarter of 2022, which is in line with the OECD average of 10.1% in Q4 2022. Among major economies, Italy witnessed the most considerable increase in inflation rates (12% by the end of 2022), followed by the Eurozone area (10.3%). Conversely, Japan, which experiences structural issues that manifest in slow GDP and inflation growth, saw a relatively lower increase, followed by Canada and the United States.
Figure 1. Inflation (CPI) annual growth rate (%) in selected countries (Q1 2018 – Q4 2022)
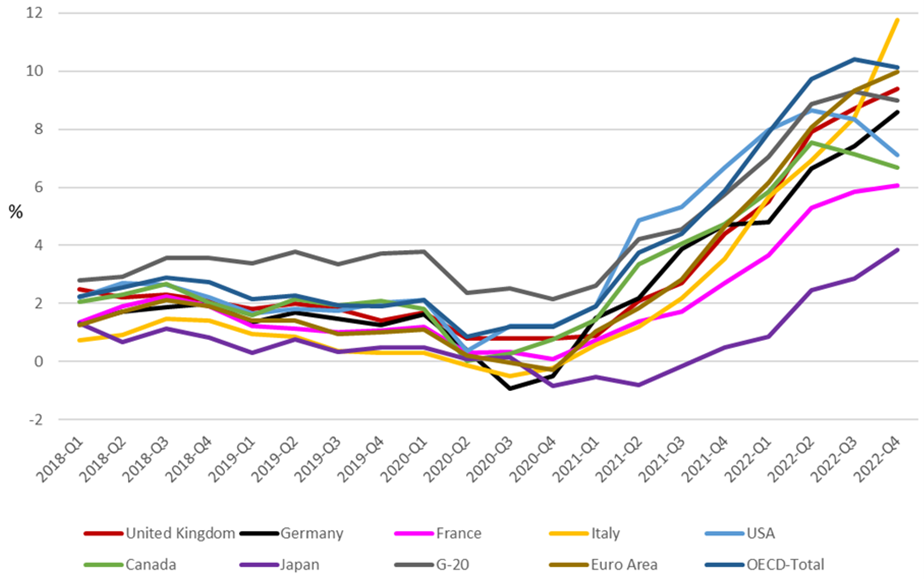
Note: The G20 group comprises Argentina, Australia, Brazil, Canada, China, France, Germany, India, Indonesia, Italy, Japan, Mexico, Russia, Saudi Arabia, South Africa, South Korea, Turkey, the United Kingdom, and the United States. Although the European Union is a full member of G-20, the G-20 aggregate only comprises individual countries that are also members.
Inflation rates began to rise through 2021 as major economies across the world recovered from the shock of the COVID-19 pandemic. However, the unforeseen and continued existence of inflationary pressures in 2022 was largely attributed to the Russian invasion of Ukraine, which led to an abrupt surge in a range of significant commodity prices including crude oil, natural gas, coal, different metals, wheat, corn, certain edible oils, and fertilisers (OECD, 2022). Although the prices for most of these commodities later dropped, partly because of China’s decreased demand, internationally traded coal and gas prices continued to remain high throughout 2022.
As in the UK, increasing energy prices have been the largest driver of the high inflation seen in other European countries. The impact of the war in Ukraine on wholesale gas and electricity prices is a common factor across the continent, but the extent to which this has been felt by consumers varies across different countries due to different patterns of resource dependency and use, different energy market conditions, and different effects of national government regulations and policies to support households (Menyhért, 2022). Notably, the annual growth rate in consumer energy prices (as of February 2023) has been markedly higher in the UK at 48.3% than in other large European economies, such as Italy (28.2%), Germany (20.0%), and France (14.0%). For the combined 27 member states that now make up the European Union, the corresponding figure is also considerably lower than the UK at 16.6% (OECD, 2023a). The reasons for this in the UK include a high dependence on gas to heat homes and generate electricity, and a large proportion of the housing stock with poor insulation and energy efficiency.
The OECD’s (2023b) Economic Outlook interim report highlights an upswing in the economic activity and consumer confidence in the major G20 economies at the start of 2023. This improvement is attributed to the drop in global food and energy costs, which has led to an increase in purchasing power and a projected decrease in headline inflation. Moreover, the global economy has been positively impacted by the reopening of China’s economy. The dip in energy prices is in part due to the moderate winter temperatures observed in Europe, leading to stabilisation in gas storage levels and curtailed energy consumption in several countries. However, the cost of energy and food is still higher than pre-pandemic levels, putting a financial strain on many low-income households. According to the above report, even though food and fertiliser prices have declined since their peak in 2022, food and energy security remain fragile, particularly for emerging economies and households with low incomes.
In addition, the headline CPI rate and the core inflation rate (the latter excludes food and energy) are still exceeding the goals of the central banks, although the headline inflation is gradually decreasing in most economies, mainly due to the reduction in food and energy prices. Inflation levels continue to vary significantly among different countries, with certain Asian economies such as China and Japan still experiencing relatively low inflation rates, while Turkey and Argentina are witnessing a surge in inflation.
The most recent inflation figures available at the time of writing show that the UK experienced an unexpected rise in the overall rate from 8.8% in January 2023 to 9.2% in February 2023. This meant that the UK had the highest inflation of the G7 advanced economies in February (as Italy fell from 10.0% to 9.1% and Germany remained at 8.7%). For the UK, the persistence of these inflationary pressures in early 2023 is attributable to the very high energy costs discussed above, but also to still rising food prices (to an annual growth rate of 18.2% in February) (OECD, 2023c). The factors behind this food cost inflation are multifaceted, including the disruption to supplies of staple commodities related to the Russian invasion of Ukraine. However, recent analysis also points towards the trade barriers introduced by the UK leaving the European Union Single Market and Customs Union in January 2021 having contributed to increasing food prices in the UK over the past two years (Bakker et al., 2022).
Due to the deceleration of worldwide economic growth, the reduction in food and energy price inflation, and the monetary constriction enforced by many central banks, inflation is anticipated to decrease across almost all G20 economies in 2023 and 2024 (Figure 2). Nonetheless, even with this projected decline, annual inflation rates are predicted to remain significantly above the target in most economies throughout 2024 (OECD, 2023b).
Figure 2. Inflation projections in the G20 countries (2023-2024)
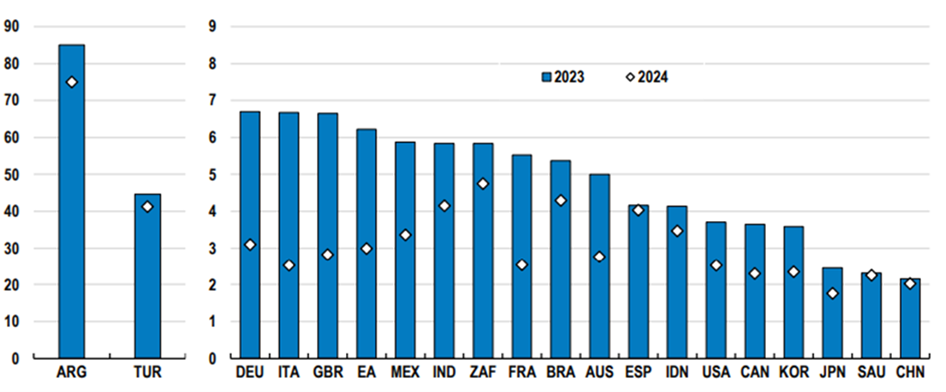
Note: ARG: Argentina, TUR: Turkey, DEU: Germany, ITA: Italy, GBR: United Kingdom, EA: Euro area, MEX: Mexico, IND: India, ZAF: South Africa, FRA: France, BRA: Brazil, AUS: Australia, ESP: Spain, IDN: Indonesia, USA: United States, CAN: Canada, KOR: Korea, JPN: Japan, SAU: Saudi Arabia, CHN: China
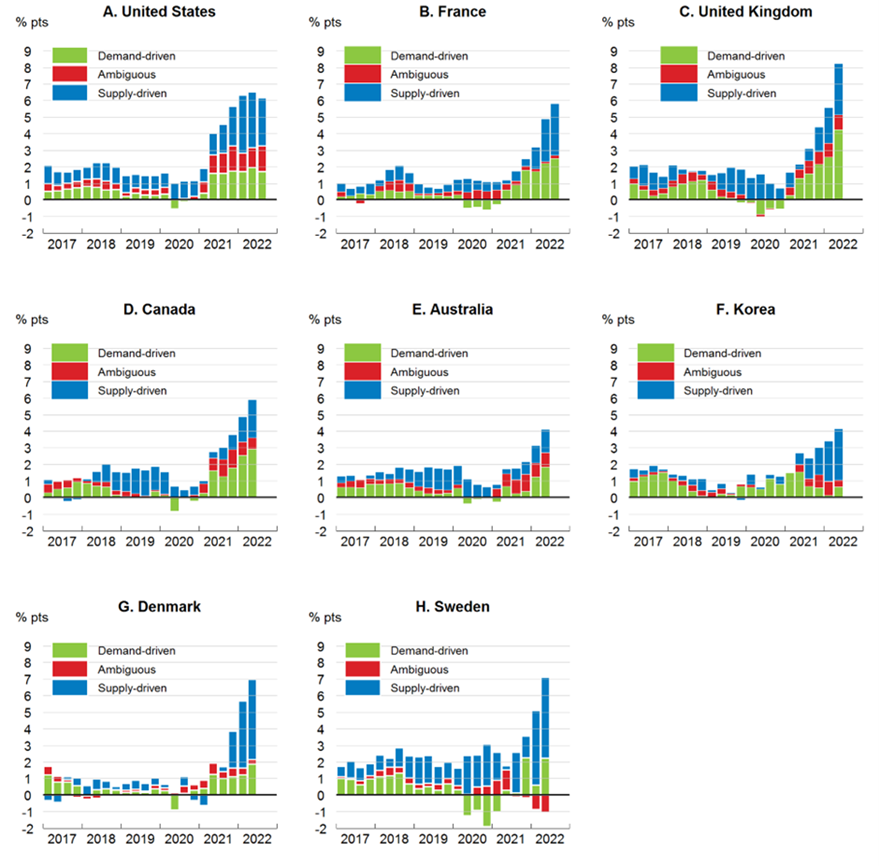
Disentangling the effects of supply and demand on inflation rates across countries
Inflation caused by demand occurs when the demand for products and services in an economy increases faster than the country’s production capacity. Because of the surplus demand, prices for products and services rise. Typically, this sort of inflation happens during periods of economic expansion, low unemployment, and wage increases. Conversely, supply-driven inflation occurs when the supply of goods and services in an economy is restrained, but demand remains constant or rises. For example, this can be caused by natural disasters, wars, trade restrictions, and supply chain interruptions. When the supply of goods and services is constrained, prices rise due to the scarcity of those goods and services. In brief, demand-driven inflation is generated by an excess of demand, whereas supply-driven inflation is caused by supply restrictions.
Figure 3 demonstrates the contribution of supply and demand-related factors to headline inflation in selected countries based on personal/household consumption expenditure data (OECD, 2022). This approach is based on the assumption that demand pressures occur when the price and volume of an item move in the same direction, whereas supply shocks occur when they move in opposite directions (e.g., a decrease in volume but an increase in prices indicates lower supply). When it is not possible to determine whether changes in prices are due to demand- or supply-driven factors, a third category called “ambiguous” is used. The results show that inflation in all these countries has been influenced by both supply and demand determinants since mid-2020. The share of inflation that is attributed to demand-driven factors in Q2 of 2022 varies from 16% in South Korea to around 50% in the United Kingdom and Canada. On average, supply-driven inflation represents approximately half of total inflation in the eight economies depicted, although it is much higher than 50% in Denmark, Korea, and Sweden.
Figure 3: Contributions of supply-and demand-driven inflation to headline inflation in selected countries (January 2017 – April/July 2022)
Cost-of-living indices: An International Comparison
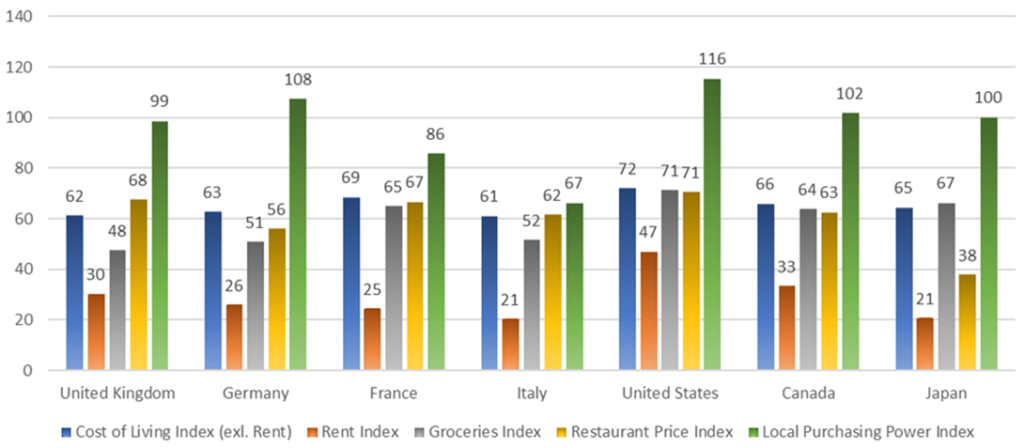
According to Numbeo’s database, the UK is ranked 33rd among 140 countries in 2023 in terms of the cost-of-living index (excluding rent). This means that the UK is positioned lower than most G7 nations, except Italy (see Table 1 and Figures 4-5). However, when factoring in housing expenses, the overall cost of living in the UK increases, ranking it 20th globally. It is noteworthy that the UK’s rank in the overall cost of living index was relatively better before the pandemic and inflation expansion of the past two years, with a rank of 31st in mid-2019.
Regarding grocery prices, the UK has a lower grocery index (47.7 in 2023) compared to many other countries, including the United States, Japan, Canada, France, Italy, and Germany. On the other hand, restaurant prices in the UK (with an index of 67.9) are relatively high compared to other G7 nations, surpassed only by the United States. Despite this, the UK has a relatively strong local purchasing power with a ranking of 14th in the world and an index of 98.9, which is higher than France and Italy but lower than the United States, Germany, Canada, and Japan. In summary, despite the fact that the UK’s cost of living is higher than many countries, it is still competitive when compared to the other G7 nations.
Table 1: Ranking of cost –of living index across countries (2023)
| Rank | Country | Cost of Living Index (excl. Rent) | Rent Index | Cost of Living Plus Rent Index | Groceries Index | Restaurant Price Index | Local Purchasing Power Index |
| 1 | Bermuda | 141.8 | 96.3 | 120.0 | 143.3 | 142.0 | 79.5 |
| 2 | Switzerland | 114.2 | 50.2 | 83.5 | 113.9 | 109.5 | 118.7 |
| 3 | Cayman Islands | 103.4 | 75.7 | 90.1 | 96.4 | 92.4 | 76.7 |
| 4 | Bahamas | 90.9 | 39.6 | 66.3 | 74.1 | 94.8 | 43.2 |
| 5 | Barbados | 88.8 | 21.2 | 56.4 | 80.1 | 82.7 | 36.8 |
| 6 | Norway | 88.6 | 30.9 | 60.9 | 81.8 | 90.6 | 95.0 |
| 7 | Singapore | 85.9 | 85.3 | 85.6 | 74.0 | 58.4 | 95.6 |
| 8 | Iceland | 83.3 | 36.7 | 61.0 | 78.3 | 86.9 | 90.1 |
| 9 | Jersey | 80.0 | 53.9 | 67.4 | 62.4 | 90.8 | 72.6 |
| 10 | Denmark | 78.6 | 30.4 | 55.5 | 62.4 | 91.9 | 105.0 |
| (Countries 11-15 not shown) | |||||||
| 16 | United States | 72.4 | 47.1 | 60.3 | 71.4 | 70.8 | 115.7 |
| (Countries 17-20 not shown) | |||||||
| 21 | France | 68.7 | 24.6 | 47.5 | 65.1 | 66.9 | 86.2 |
| (Countries 22-24 not shown) | |||||||
| 25 | Canada | 66.1 | 33.4 | 50.4 | 64.2 | 62.8 | 102.1 |
| (Countries 26-28 not shown) | |||||||
| 29 | Japan | 64.6 | 20.8 | 43.6 | 66.5 | 37.9 | 100.4 |
| 30 | Germany | 62.9 | 26.1 | 45.3 | 50.9 | 56.2 | 107.6 |
| (Countries 31-32 not shown) | |||||||
| 33 | United Kingdom | 61.5 | 30.3 | 46.6 | 47.7 | 67.9 | 98.9 |
| (Country 34 not shown) | |||||||
| 35 | Italy | 61.3 | 20.5 | 41.7 | 51.9 | 61.9 | 66.5 |
| (Countries 36-135 not shown) | |||||||
| 136 | Libya | 24.2 | 5.2 | 15.1 | 23.1 | 19.3 | 32.1 |
| 137 | Colombia | 23.1 | 7.0 | 15.4 | 21.0 | 17.3 | 31.1 |
| 138 | India | 22.4 | 5.5 | 14.3 | 23.3 | 15.7 | 64.6 |
| 139 | Egypt | 21.6 | 4.3 | 13.3 | 19.6 | 18.0 | 21.9 |
| 140 | Pakistan | 18.0 | 3.4 | 11.0 | 15.4 | 13.7 | 24.4 |
| 140 | Pakistan | 18.0 | 3.4 | 11.0 | 15.4 | 13.7 | 24.4 |
The indices shown in the Table are relative to New York City (NYC), with each index set at 100 for NYC. For instance, if a country has a rent index of 30, it implies that rents in that country are on 70% cheaper on average than in NYC. These indices represent a snapshot of the current indices at a specific point in time in 2023. Country rankings in the Table are based on the cost of living index (excl. rent).Cost of Living Index (Excl. Rent) is a relative indicator of consumer goods prices, such as groceries, restaurants, transportation, and utilities, excluding rent or mortgage expenses. Rent Index estimates the cost of renting apartments in a given country compared to NYC. Cost of Living Plus Rent Index estimates consumer goods prices including rent compared to NYC. Groceries Index estimates grocery prices in a given country compared to NYC. Restaurants Index is a comparison of prices of meals and drinks in restaurants and bars compared to NYC. Local Purchasing Power demonstrates the relative purchasing power in buying goods and services in a given country. For example, if the domestic purchasing power is 86, it implies that people in that country with an average salary can afford to buy 14% fewer goods and services than NYC residents with an average salary.
Source: Numbeo (2023)
Figure 4: Cost of living index (excl. rent) in the G7 countries (2023)
Note: For detailed information about the indices, see the note in Table 1.
Figure 5: Cost –of living index (excl. rent) (2023)
Nominal Wages, job vacancies and real wages
The current economic landscape in most major countries is characterised by low unemployment rates and high vacancy rates. This, coupled with a prolonged period of high inflation discussed earlier, has resulted in an escalation in nominal wage growth, as shown in Figure 6. Nevertheless, certain economies (such as the United States) are experiencing a significant slowdown in the pace of wage increases, or in some cases a decline.
Figure 6: Wage growth and job vacancies per unemployed people in selected countries

Note: Panel A shows the average annual increase or decrease in wages and salaries advertised in job listings on Indeed, accounting for job titles.
Panel B shows the ratio of job openings that remain unfilled to the total number of individuals aged 15 and above who are unemployed.
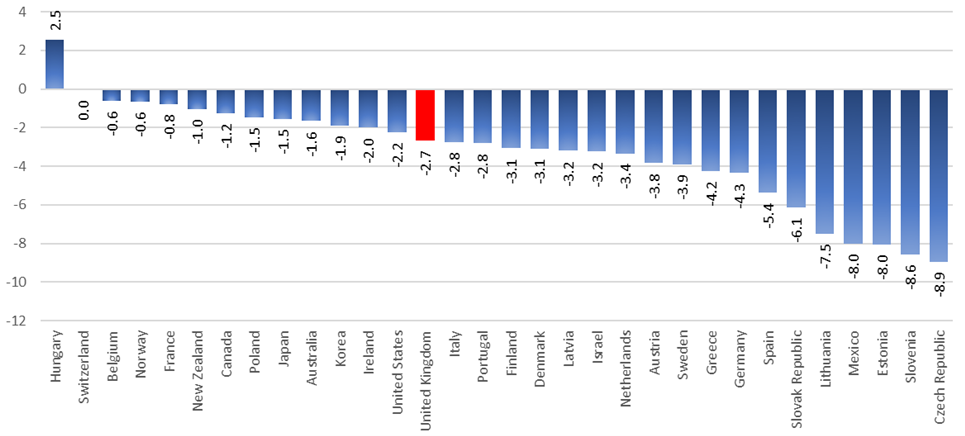
In spite of the labour market tightness and increasing nominal wages, most countries have witnessed a notable decline in real wages (which accounts for inflation), indicating a general decrease in the purchasing power of their workforce. Specifically, the annual reduction in real wages in the third quarter of 2022 was 2.7% in the UK, albeit it was lower than the average of 32 OECD countries with available data (3.3%). The UK government’s energy plan encompasses a cap on household energy bills and other forms of assistance for businesses, thereby supporting them with energy price increases. This is particularly critical for lower-income families, as their energy expenses usually comprise a larger portion of total expenditures relative to high-income families. The structure of household expenditure across different income groups does vary from country to country. However, analysis at the EU level has shown that, in most member states, the impact of inflation on energy and food prices has also disproportionately affected families with lower incomes (Menyhért, 2022; Vidal and Villani, 2022). Correspondingly, national governments across Europe have also (like the UK) introduced special measures to financially protect their citizens from the rapid rise in energy costs (see Sgaravatti et al. 2023).
Figure 7: Year-over-year changes (%) in real wages per employee in selected countries (Q3 2022)
Source: OECD (2022)
View and download the full REDI Updates report.
This blog was written by Dr Kostas Kollydas and Dr Paul Vallance, Research Fellows, City-REDI / WMREDI, University of Birmingham.
Disclaimer:
The views expressed in this analysis post are those of the authors and not necessarily those of City-REDI / WM REDI or the University of Birmingham.