
The Birmingham Economic Review is out now!
This year’s report will provide a comprehensive analysis of the city’s economy amid the wider geopolitical landscape, and actionable measures that businesses and stakeholders from across the city-region can take to drive economic growth.
Read the full Birmingham Economic Review 2025.
Donald Houston explores Greater Birmingham’s long‑term labour market resurgence—driven by population growth, rising employment, and falling inactivity—while highlighting emerging challenges such as increasing work‑limiting disability.
Long-term success
Greater Birmingham’s labour market is stronger than it ever has been. The city’s population of working age has shown robust growth for the last 25 years, after precipitous decline in the 1960s and 1970s and stagnation in the 1980s and 1990s. Greater Birmingham has seen strong jobs growth over the last decade, up by some 125,000. The proportion of the working age population in employment is at its highest yet. Not only has economic inactivity fallen below its pandemic spike but continues its long-term downward trend and is now lower than at any time before. Unemployment is at its lowest in modern times. Youth unemployment has remained below 10% for the last four years. The employment gap in the city-region faced by ethnic minorities has shrunk. Finally, the city-region has regained the ground it lost relative to the UK in the aftermath of the Global Financial Crisis. A new challenge, however, is the rise in work-limiting disability in the population, which requires concerted improvements in public health as well as support to job seekers, employees and employers to manage health conditions and disability in the workplace.
Taking the long view
Population change is an indicator of city success, as it reflects the relative attractiveness of a place. Population has the advantage of being unambiguous and relatively easy to measure, yielding a consistent measure over long periods. As well as providing a barometer of success, population growth itself contributes to economic growth. The good news is that Greater Birmingham has finally recently regained all the population it lost in its economic and demographic freefall of the 1960s and 1970s.
In terms of the labour market, population change is both cause and consequence of a city’s change in employment. On the one hand, population concentrations in cities are important for labour supply and the wider business environment, providing deep labour pools for businesses, large and diverse local consumer markets and a flow of innovation and creativity, all of which serve to boost growth. On the other hand, employment opportunities attract and retain population in a city or region.
The renaissance of British metropolitan areas as places to live since around the turn of the 21st century stands in stark contrast to their torrid time in the second half of the twentieth century. Birmingham’s population, and employment base, declined precipitously in the 1960s and 1970s followed by a long period of negligible and low growth throughout the 1980s and 1990s (Figure 1). Taking a very long view of the city’s development, the general trend is one of growth. Before its zenith in the early 1960s, Birmingham’s population had grown continuously and rapidly throughout the preceding century and a half, from just 86,559 in the first Census of Population in 1801.
Figure 1. Population of Birmingham, 1801-2021
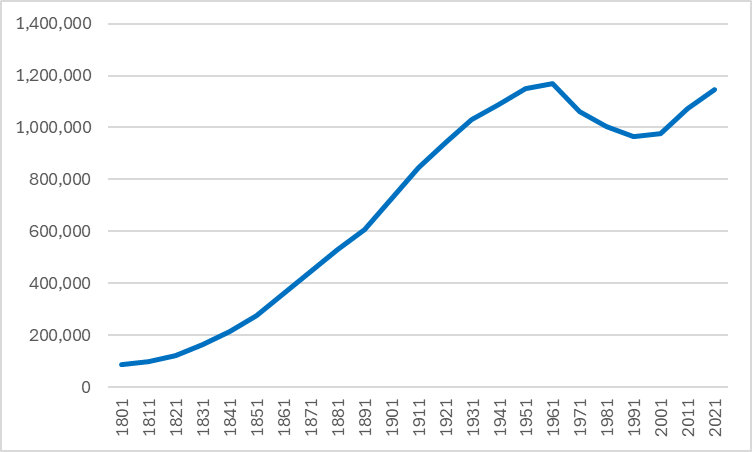
Since the renaissance of Birmingham and other large British cities during the 21st century, the population of working age (16-64 years) in the Greater Birmingham city-region has grown by 17%, representing an increase of almost 200,000, up from 1.14 million in 2000 to 1.34 million in 2024, driven mainly by international immigration. The population as a whole grew over the same period by some 315,000, from 1.81 million to 2.13 million. The city-region’s population of children under 16 years of age has also grown, and grown more than for the UK.
Trends in jobs and employment
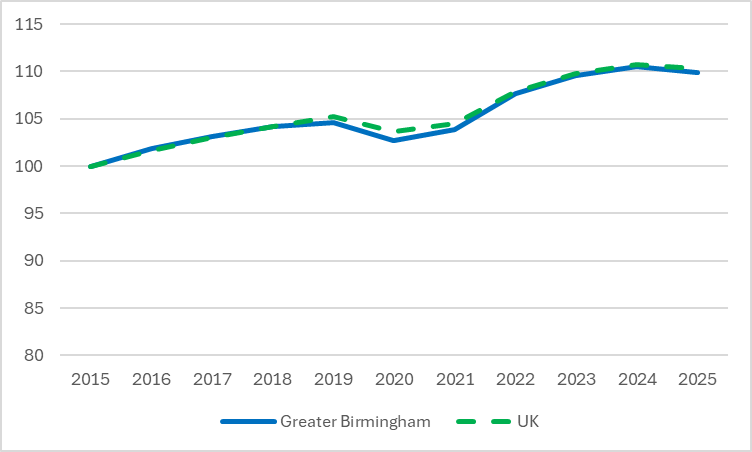
On the demand side of the labour market, Greater Birmingham has seen considerable growth in the number of jobs located in the city-region, up by some 80,000 since 2015 and currently sitting at around 880,000. Greater Birmingham’s jobs growth since 2015 is in line with the UK, with ground lost relative to the UK during the pandemic is now largely recovered (Figure 2).
Figure 2. Jobs growth, 2015-2025, Greater Birmingham and UK (2015 = 100)
On the supply side of the labour market, the number of employed residents in Greater Birmingham has grown broadly in line with employee jobs in the city-region (Figure 3), up by around 100,000 since 2015 to currently stand at some 970,000. That the upward trend in employed residents mirrors the upward trend in the demand for labour (as proxied by employee jobs in the city-region) suggest that increased job availability has been an important factor in driving up the supply of labour and employment prospects of residents.
Figure 3. Growth in jobs and employed residents, 2015-2025, Greater Birmingham (2015 = 100)

Labour market trends
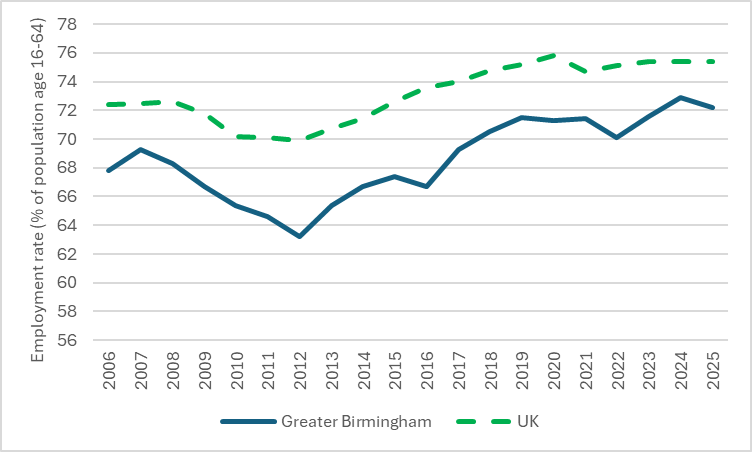
The UK Government has set a national target of an employment rate of 80% of the population aged 16-64. Greater Birmingham’s employment rate currently stands at 72.2%, which is considerably up from its post Great Recession low of 63.2% in 2012 and exceeds its pre-pandemic level (Figure 4). Set in historical context, Greater Birmingham’s employment rate is the highest it has ever been, driven by a long run increasing participation in the labour market by women. The gap between Greater Birmingham and the UK widened for almost a decade (2008-2017) following the Great Recession, ground which has been recovered over the last eight years (it widened again following the COVID-19 pandemic, but only briefly). Greater Birmingham’s employment rate was some 5-7 percentage points behind the UK’s in the years following the Great Recession, but more typically runs around 2-4 percentage points behind the UK (seen in the periods 2005-08 and most of 2017-25). For comparison, the UK’s employment rate has also recovered since dipping in the years following the Great Recession (Figure 4). The UK’s annual employment rate is also at a high in historic terms, although at 75.4%, unlike Greater Birmingham, has yet to regain its pre-pandemic all-time high.
Greater Birmingham’s employment rate has always lagged behind the UK’s and, realistically, will continue to do so for the foreseeable future. In this regard, Greater Birmingham is in line with other large cities that are characterised by concentrations of social deprivation and large student and ethnic minority populations, which inevitably and arithmetically bring down the employment rate. Based on past trends, if the UK’s employment rate were to reach the Government’s target of 80%, we might expect Greater Birmingham’s to be around 77%.
Figure 4. Employment rate, 2006 – 2025, Greater Birmingham and UK
Although higher than it should be, unemployment is still relatively low by historic standards, with the UK national unemployment rate (4.7% in August 2025) currently lower than at any time in the period between 1975 and 2016. National unemployment exceeded 7% in almost all months between 1980 and 1997 and again from the beginning of 2009 until the end of 2013. However, there is still a need to bring unemployment down, which is feasible given that unemployment was considerably lower than at present in the three years prior to the COVID-19 pandemic, 2016-2019. In the last year, unemployment has increased in both Greater Birmingham and the UK since 2024 (Figure 5).
As with unemployment, economic inactivity is also low by historic standards. The economic inactivity rate has been on a long-term downward trend for decades, falling from 24-25% nationally in the 1970s to 21-22% over the last decade6. This has been driven by increasing participation in the labour force by women and by jobs growth. Seen in this historic context, the pandemic spike in economic inactivity remained below levels that prevailed until only five years before the pandemic struck (specifically, 2015). Since the pandemic, the long-term historic downward trend in economic inactivity has resumed its pre-pandemic trajectory (Figure 5).
Nevertheless, the pandemic did spawn a short, sharp rise in economic inactivity that contributed to labour shortages and economic hardship for some of those affected. Nationally, the economic inactivity rate among people aged 16-64 rose from 20.3% in the quarter immediately prior to the pandemic lockdown starting (Dec’19-Feb’20) to peak at 22.2% in May-July’22 (a level that was reached for a second time in Feb-April’24 after a partial recovery during 2023). This is a rise of 1.9 percentage points, or 1.9 out of every 100 people aged 16-64 becoming economically inactive in just over two years. Volatility in the monthly rolling quarterly data means that these national peaks are somewhat smoothed in the annual data reported in Figure 5, but the sharp rise in economic inactivity in Greater Birmingham can be seen even in the annual data, rising by 1.7 percentage points, or 1.7 out of every 100 people aged 16-64, from 23.5% in the 12 months prior to the pandemic (April’19-Mar’20) to 25.2% two years later in 2021-22 (Figure 5). Economic inactivity has come down somewhat since the peak after the pandemic, particularly in Greater Birmingham where it currently stands at around its pre-pandemic level (23.4% in 2024-25).
Figure 5. Economic inactivity and unemployment rates*, 2006 – 2025, Greater Birmingham and UK
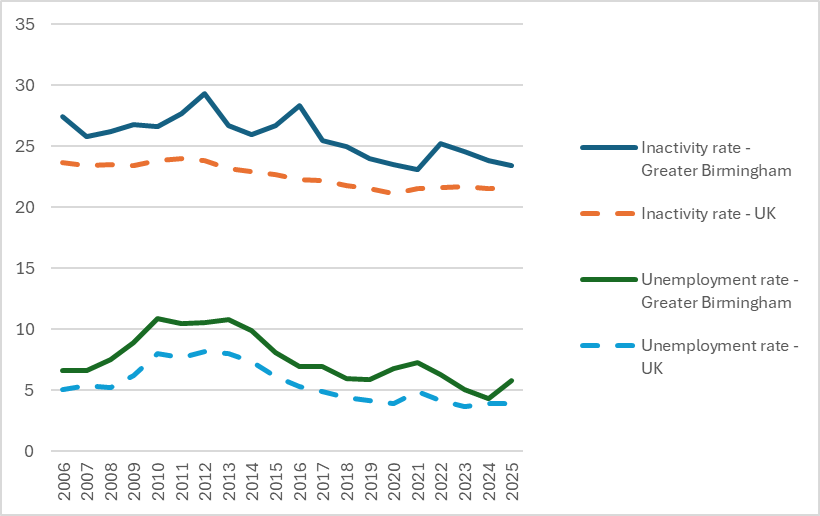
* The unemployment rate is based on the economically active population; the economic inactivity rate is based on the whole population (i.e. economically active and inactive persons). Unemployment is defined as an individual who is not currently employed and is both searching and available for work. The economically active population (the labour force) comprises the employed and the unemployed. Economic inactivity refers to those not currently employed and not searching and/or available for work. All rates are based on the population aged 16-64 years.
An inactivity crisis or a health crisis?
A lot has been reported in the media and by government of the rise in economic inactivity since the COVID-19 pandemic. The health component of this has been detected by, but substantially under-estimated, in the main reason for inactivity measure reported in published labour market data (Figure 6). Many people who are economically inactive for reasons other than health (for example, looking after family and home) also have health problems, but do not give health as the main reason for being economically inactive. This is why the main reason for economic inactivity measure significantly under-records the prevalence of health problems among the economically inactive population. An alternative is to count the number of inactive people with a work-limiting disability, which is derived from questions about health and its impact on ability to carry out daily activities or employment that are asked separately from the questions about economic activity in the Annual Population Survey/Labour Force Survey.
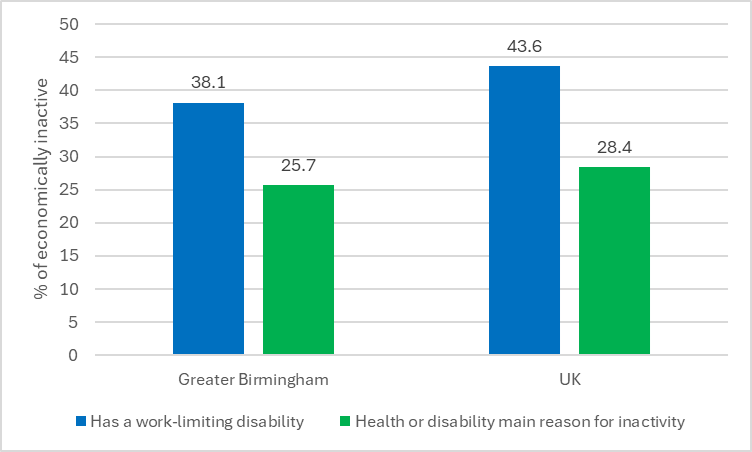
Comparing the two measures is quite startling (Figure 6). For the UK, 28.4% of inactive people give health or disability as the main reason that they are economically inactive – yet substantially more, 43.6%, have a work-limiting disability. This means that the economically inactive population who face health- or disability-related obstacles to employment is considerably larger than the published figures on reasons for inactivity suggest – specifically, 3.9 million rather than 2.6 million for the UK. For Greater Birmingham, the figures are 38.1% of the inactive representing 115,000 people, rather than 25.7% representing 78,000 people in the published figures7.
Figure 6. Alternative measures of the prevalence of health problems amongst the economically inactive (16-64 years), 2025, Greater Birmingham and UK
Population health is deteriorating, at least with respect to work-limiting disability, which has risen by 5 percentage points (or 1-in-every-20 people) over the last decade, from around 15% to 20% of the UK’s population aged 16-64 (Figure 7). Greater Birmingham follows a similar trend, but on a less steep trajectory, rising from around 15% to 18% (Figure 7). Although the pandemic accelerated this rise in work-limiting disability, it is important to note that it was an established trend prior to the pandemic, driven by the demographic profile of the working-age population getting older, and, some argue, increased work demands from employers and rising waiting times on the NHS.
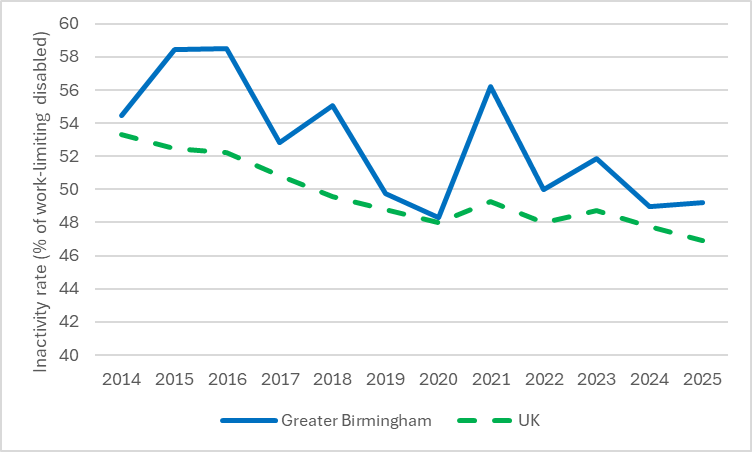
Economic inactivity among those with a work-limiting disability has improved in the UK and Greater Birmingham over the last decade (Figure 8). This mirrors the downward trend in economic inactivity as a whole over this period. Although the long-term trend is for economic inactivity among people with work-limiting disabilities to come down, there was a sharp increase in inactivity for this group following the COVID-19 pandemic, again mirroring what happened in the population as a whole, particularly in Greater Birmingham, although the downward trend has resumed and pre-pandemic levels have been regained (Figure 8). Although there is still huge room for improvement, the majority (>50%) of people with work-limiting disabilities have been in the labour force since 2018 for the UK and for Greater Birmingham in 2019 and 2020 and again since 2024 as the city-region recovers from the pandemic.
The analysis reported here reveals that the problem of health-related inactivity is driven by a rise in the prevalence of work-limiting disability since the pandemic and not by a reduction in the propensity of disabled people to be in the labour force. This has important policy implications – in short, we face a public health problem rather than a labour market problem per se.
Figure 7. Prevalence of work-limiting disability in the population aged 16-64, 2014 – 2025, Greater Birmingham and UK
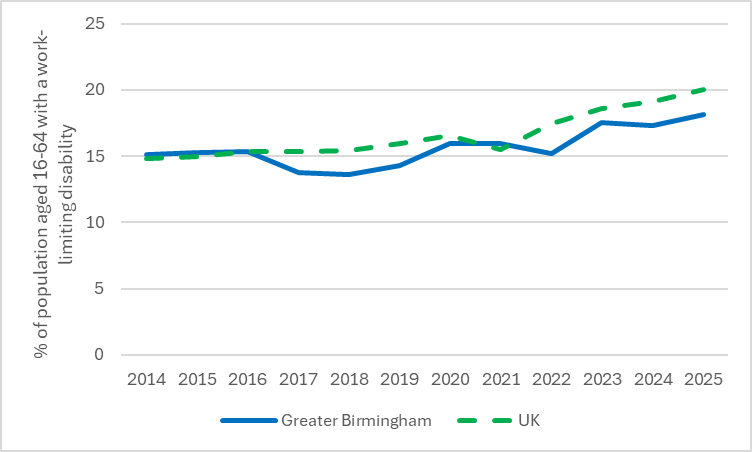
Figure 8. Economic inactivity among those reporting a work-limiting disability, 2014 – 2025, Greater Birmingham and UK
Conclusions
In these times of doom and gloom on the state of the UK economy, it serves us well to look back at how far the labour market of the Greater Birmingham city-region, and indeed the UK as a whole, has come. The jobs haemorrhage and ensuing dark days of mass long-term unemployment of much of the second half of the twentieth century are far behind us, albeit scars remain. The Global Financial Crisis of 2008 and ensuing Great Recession set things back, but the city-region’s labour market has regained, and now improved on, pre-crisis levels. The pandemic and Brexit limited labour supply and a brief labour shortage held back growth, but not for long.
In short, the city-region’s demographics and labour market have shown resilience. Sure, there have been bumps (not to mention potholes…) in the road, and the labour market’s recovery has stalled in the last 12 months. But the long-term improvement is clear.
Ongoing analysis of the trends remains crucial in order to properly diagnose challenges and design solutions. We have not long ago come out of a global pandemic. Population health has suffered and many more people face health-related obstacles to employment than before the pandemic. A lot of economically inactive people have work-limiting disabilities but do not give health or disability as their main reason for economic inactivity. This means that the economically inactive population who face health or disability related obstacles to employment is considerably larger than the published reasons for inactivity figures suggest.
This blog was written by Professor Donald Houston, Professor of Regional Economic Development, City-REDI, University of Birmingham.
Disclaimer:
The views expressed in this analysis post are those of the authors and not necessarily those of City-REDI / WMREDI or the University of Birmingham.