In this case study, we hear from Adrià Fontrodona-Bach (4th year Ph.D. student Geography), who has been making use of BlueBEAR and the BEAR Portal to enable him to create large Open Access datasets.
“We need data” is a common statement in academic research. However, environmental data is usually scarce, unreliable, or inaccessible. As part of my PhD, I have generated and published an Open Access dataset of snow water equivalent that covers the Northern Hemisphere and provides time series from 1950 to 2022 at the point scale. But why is this snow dataset important, and how did BlueBEAR help produce it?
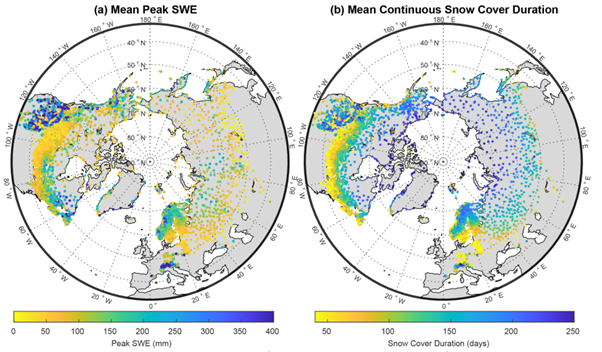
Snow is made of water and air. For certain applications, we need to know how much water there is in the snow, but this can vary from 10% to 60% of the total snow depth, and it is difficult to estimate. However, the depth of snow is very easy to measure with a ruler or measuring pole. Over decades, snow depth has been measured daily at thousands of locations in the world, and these long term historical observations are becoming available through the publication of regional datasets. In short, I have gathered as many of these snow depth observations as possible over the Northern Hemisphere, and I have used a model to estimate the amount of water in the snowpack, the snow water equivalent (SWE), for all those observations. I have made the resulting dataset available as open access https://zenodo.org/record/7565252 , and published a data paper that describes all the data and methods used (Fontrodona-Bach et al., 2023) https://essd.copernicus.org/articles/15/2577/2023/.
As you can imagine, this is a lot of data to gather and to work with, and BlueBEAR has certainly made this work possible. Many large datasets are made available to the public through Application Programming Interfaces (API), which allow the user to download data on demand and interactively by using code. I managed to download data quickly and efficiently by submitting job scripts with the API code to BlueBEAR and storing the downloaded data in the BEAR Research Data Store (RDS), without worrying about storage capacity.
In the next step, I used the MATLAB GUI from the BEAR Portal. I developed a gap-filling method for the snow depth data based on machine learning models called Artificial Neural Networks. These models need to be trained and require some computation time. I had run the model several times to test the performance of the gap-filling method. Let’s say the average training and test time takes 10 seconds, but you need to do it 100 times to test the performance, and for a 10,000 time series. That would take 115 days! By parallelising the code, and using 40 cores in a MATLAB session in the BlueBEAR portal, I left the code running on the MATLAB GUI on Friday evening, and it was done on Monday morning.
By sending array jobs to the BlueBEAR cluster through PuTTy, this was done in (merely) a couple of hours
But this is not the end of the story. I still needed to calibrate and run the model that estimates the water equivalent of snow from the snow depth observations. This model was originally coded in R, so I used the Rstudio GUI from the BEAR portal. For calibration, I used a 800 time series that had observations of both snow depth and water equivalent, and I prepared a 100 model parameter sets. Again, a one model run for one year takes about 1 second of computation time, multiply it by 25 years on average, 100 runs for the parameter sets, and a 800 time series and it would take 23 days! By sending array jobs to the BlueBEAR cluster through PuTTy, this was done in merely a couple of hours. For the final data processing and making plots, my laptop struggled to load the entire dataset in the workspace, but this was absolutely no problem for the BEAR portal applications.
We were so pleased to hear of how Adrià is able to make use of what is on offer from Advanced Research Computing, particularly to hear of how he has made use of the BlueBEAR HPC and the BEAR portal – if you have any examples of how it has helped your research then do get in contact with us at bearinfo@contacts.bham.ac.uk. We are always looking for good examples of use of High Performance Computing to nominate for HPC Wire Awards – see our recent winners for more details.
- Fontrodona-Bach, A., Schaefli, B., Woods, R., Teuling, A. J., and Larsen, J. R.: NH-SWE: Northern Hemisphere Snow Water Equivalent dataset based on in situ snow depth time series, Earth Syst. Sci. Data, 15, 2577–2599, https://doi.org/10.5194/essd-15-2577-2023 , 2023.
- Fontrodona-Bach, Adrià, Schaefli, Bettina, Woods, Ross, Teuling, Adriaan J, & Larsen, Joshua R. (2023). NH-SWE: Northern Hemisphere Snow Water Equivalent dataset based on in-situ snow depth time series and the regionalisation of the ΔSNOW model [Data set]. Zenodo. https://doi.org/10.5281/zenodo.7565252