There is increasing concern about the financial viability of some local authorities with estimates by the LGA suggesting that councils in England are facing a funding gap of £4 billion.
In 2023 Birmingham City Council (BCC) was served a section 114 notice. This means that effectively the council ran out of money. In short, BCC needs to raise £300m to fulfil its budget deficit over 2 years. The ways in which this ‘financial hole’ is addressed will impact some households more than others. Birmingham City Council however is not the only council in crisis with an estimated £4bn funding gap severely impacting services.
In this blog, Matt Lyons and Kurt Kratena use an economic model – the SEIM-UK – to consider how different household groups are likely to be impacted by the potential policy responses to address the deficit and what policy lessons can be learned
View our policy briefing – Addressing the local authority financial crises
How is the BCC responding to the Crisis?
There are two main levers BCC is pulling to address the crisis namely, council tax rises and spending cuts (the main levers open to all councils).
Council tax rises have been announced and take the form of a 9.99% rise in 2024-25 and again in 2025-26. Those households on low incomes – around 75,000 households out of the 461,000 households in Birmingham – will be exempt from the council tax rises.
Spending cuts are not fully detailed as yet but early announcements included:
- Dimming of street lights (saving £1m per year)
- 600 job cuts in local government
- Reduced frequency of waste collection
- Spending cuts on highways (saving £12m annually)
- Adult social care to be cut £23.7m from a total budget of £471m
- Children’s Young People and Families department will be forced to find £51.5m in savings
- Renegotiating children’s travel contracts could also save £13m a year
Calibrating these changes for modelling
The SEIM-UK a model developed by City-REDI allows for the simulation of changes to the regional economy. By simulating different policies or shocks (positive or negative) we can gain an understanding of how regions and households can be impacted.
We estimate the BCC will have to raise £300m over two years and based on what has been published so far (above), we estimate the money will be raised through three avenues”
- £130m will be raised through council tax rises.
- £81m will be saved through reductions in council spending.
- £88m will be saved through reductions in social care spending.
We input these changes into the SEIM-UK in three ways. i) We incorporate the council tax raises through altering the effective tax rate for different household groups. ii)We incorporate the cuts in council spending that relate to goods and services as reductions in public consumption. iii) We incorporate the cuts to social care through reduced government transfers.
What is the potential impact on household groups?
Using the SEIM-UK economic model we estimate the impact of these cuts and tax rises on household groups by income quintile.
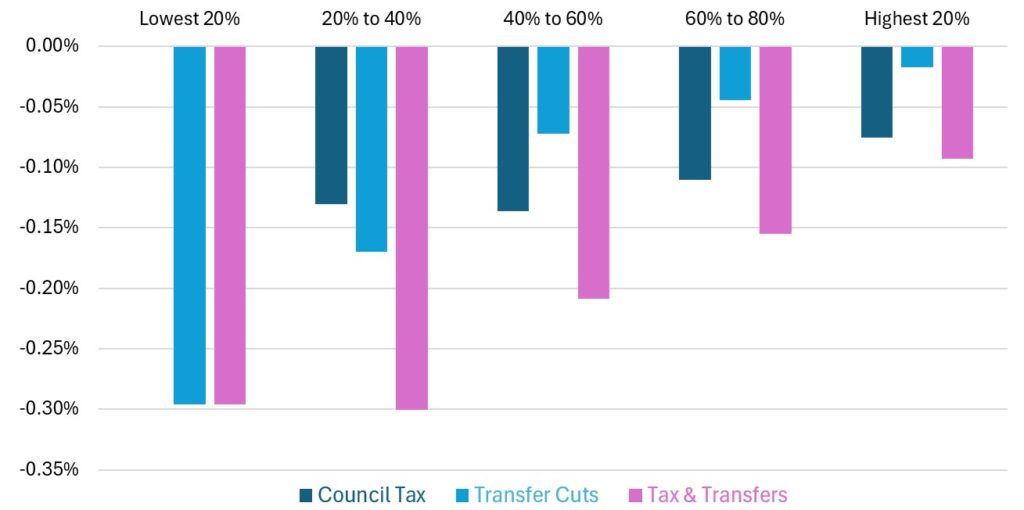
Figure 1 shows the impacts on real incomes. What we observe is council tax rises most impact those with incomes in the 40% to 60% quintile, representing those who earn between £32,300 and £43,500. The impact is closely followed by those in the 20-40% quintile. The analysis shows that those on the lowest incomes (below £14,000) are effectively protected from this rise while, at the same time, those on the highest incomes (earning over £43,500) are least impacted.
Transfer cuts refer to reductions in government social welfare payments, in this case, cuts to social care spending. The modelling shows the impact of transfer cuts is disproportionately felt by those in the lowest two income groups, especially those with incomes below £14,000.
Taken together the analysis indicates the BCC crisis is likely to be most heavily felt by those on lower incomes, with those on the lowest incomes observing a small but significant drop in incomes -0.30% against those on the highest incomes who observe just a -0.09% fall.
Figure 1. Direct real income impact, council tax & transfer cuts by household income group

Source: SEIM-UK
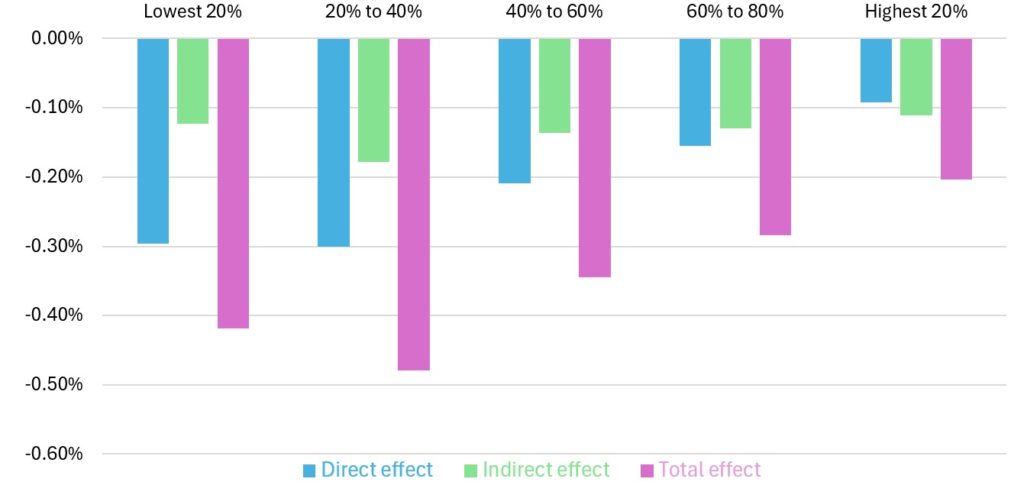
Figure 2 separates the impact of these changes into direct, indirect, and total (direct + indirect). Unlike Figure 1, Figure 2 also includes the impact of public consumption cuts i.e. a reduction in government spending on goods and services for public use.
When we consider the additional impacts of public consumption cuts and the indirect impacts unsurprisingly, we see all income groups see further falls in incomes. Perhaps more surprisingly, we find that the lowest income group is no longer the biggest loser.
Figure 2 shows that those in the lowest income group see incomes fall -0.42% but the second lowest quintile (20% to 40%), representing those with incomes between £14,500 to £23,500 see incomes fall further still, by -0.48 %. This is due to the relatively greater exposure to indirect impacts generated by other quintiles.
As we go up the income quintiles, we observe the indirect impact makes up a relatively higher share of the overall impact until in the highest 20% the indirect impact is greater than the direct impact. This reflects well-established findings that the spending of low-income households generates a significant income increase for higher-income households, who – in turn – spend proportionally less of this income increase, thereby generating only a small income feedback for low-income-households. This mechanism also works for income decreases and is responsible for the relatively high indirect impact on the top earners.
Figure 2. Direct, indirect and total real income impact of tax rises, transfer and public consumption cuts*

*Note: Unlike Figure 1, Figure 2 includes the impact of public consumption cuts
Source: SEIM-UK
Concluding remarks
Modelling results indicate that the BCC crisis will have significant and negative impacts on households across income groups.
One might assume that the poorest will be hit hardest by tax and fiscal shocks. The results show more nuance than this – indicating that while lower-income households are hit harder than higher-income households it is those with incomes of £14,500 to £23,500 that will be the most impacted seeing their real incomes fall -0.48%.
The cuts to public consumption and transfers are likely to have further compounding negative effects not captured by the modelling. The impact of cuts to the Children’s Young People and Families department will mean less money for services such as parental education, children’s mental health, nutrition, and other important services. Birmingham is also in a homelessness crisis – the financial crisis in the BCC will mean the council has fewer resources to respond, potentially further worsening outcomes for those most vulnerable in the city.
After years of austerity and cuts to council budgets what is clear is this is not just an issue for the BCC. According to a survey by the Local Government and Information Unit, 9% of councils surveyed were likely to declare effective bankruptcy in the next 12 months.
As more councils come under financial pressure increasingly councils will have to decide how to deal with their deficits. What our analysis shows is that both spending cuts and tax rises will negatively impact households especially those on lower incomes. However, it also shows that council tax rises are a less regressive way of addressing the budget deficit than transfer cuts.
Financial crises in local government are likely to be an ongoing challenge for the new Labour Government which may see council tax rises as the least worst option.
View our policy briefing – Addressing the local authority financial crises
This blog was written by Dr Matt Lyons, Research Fellow at City-REDI, University of Birmingham, and Kurt Kratena, Senior Economist at CESAR: Centre of Economic Scenario Analysis and Research, Austria.
Disclaimer:
The views expressed in this analysis post are those of the authors and not necessarily those of City-REDI or the University of Birmingham.
