The UK has the highest rates of homelessness in the developed world, with a significant increase over the past 14 years, particularly in the West Midlands. Alongside the physical, emotional and psychological impact it has on the individual, homelessness creates a substantial financial burden on local authorities, with Birmingham having the highest temporary accommodation expenses outside of London.
Matt Lyons and Maryna Ramcharan discuss how the WMREDI homelessness prediction tool aims to help policymakers in the West Midlands anticipate and mitigate future rises in homelessness.
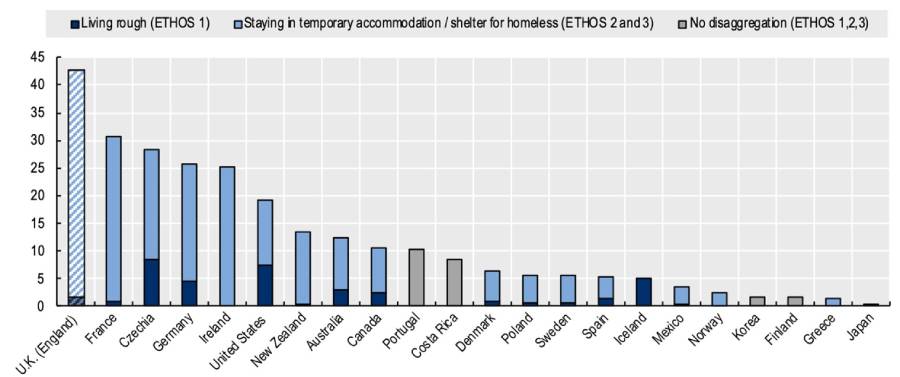
Last week the FT reported that the UK has the highest rates of homelessness in the developed world. The piece used OECD data published in 2024 which indicated that homelessness in the UK was at the highest rate of all countries by some margin:
Figure. 1 Homelessness by country per 10,000 people, 2023

People experiencing homelessness who are living rough (ETHOS 1) or staying in emergency accommodation or accommodation for the homeless (ETHOS 2 and 3), Source: OECD, 2024 p.4.
The FT reports that the level of homelessness in the UK has risen dramatically over the past 14 years. In 2010, the rates of homelessness in England were 24 people per 10,000 (roughly one in 417 people), a level comparable to other European countries like Austria and Germany. The most recently available data shows the rate has jumped to 42 per 10,000 or 1 in 238 people, substantially higher than the next worst country France, with 31 per 10,000.
It is important to note that there are two measures of homelessness on display. Definition 1 (ETHOS 1) of homelessness is defined by people sleeping on the street for which the UK (England) has lower rates than many of the nations compared. Definition 2 (ETHOS 2 and 3) includes people staying in temporary accommodation.
The harms of living in such accommodation are set out in a report by Shelter. The poor conditions, including damp and infestations, have been linked to 55 deaths of children.

What about the West Midlands?
The latest data show that the West Midlands has the second highest rate of households living in temporary accommodation (TA) outside the Greater South East at 2.96 people per 1000, significantly above the English average excluding London of 2.43.
By another measure, ‘households assessed as homeless’ the West Midlands fares better but is still significantly above the England average excluding London at 1.90 and 1.72 respectively.
Table 1: Homelessness per (000s) 2023 by English region
| Region | Total number of households in TA per (000s) | Households assessed as homeless per (000s) |
| London | 17.42 | 2.72 |
| South East | 3.48 | 1.34 |
| East of England | 3.06 | 1.47 |
| West Midlands | 2.96 | 1.90 |
| North West | 2.41 | 2.19 |
| South West | 2.15 | 1.66 |
| East Midlands | 1.63 | 1.54 |
| Yorkshire and The Humber | 1.30 | 1.67 |
| North East | 0.79 | 2.32 |
| England Average | 4.70 | 1.87 |
| England excl. London Average | 2.43 | 1.72 |
Source: UK Gov
As we look within the region we can see that by different measures of homelessness, there is significant variation by Local Authority. Coventry and Dudley are the worst affected in terms of households assessed as homeless 3.9 and 3.8 per 1000. In terms of those in TA, the rates are highest for Birmingham (10.9) and Coventry (7.1).
So, although this is a national problem, it is a crisis at the sub-regional scale.
Table 2 Homelessness rates in the West Midlands 2023
| Rank | LA | Households assessed as homeless per (000s) |
Total number of households in TA per (000s) |
| 1 | Coventry | 3.9 | 7.1 |
| 2 | Dudley | 3.8 | 0.1 |
| 3 | Stoke-on-Trent | 3.1 | 0.5 |
| 4 | Redditch | 2.7 | 0.9 |
| 5 | Worcester | 2.4 | 0.9 |
| 6 | Birmingham | 2.2 | 10.9 |
| 7 | Wolverhampton | 2.2 | * |
| 8 | Stratford-on-Avon | 1.7 | 0.8 |
| 9 | Shropshire | 1.7 | 1.6 |
| 10 | Rugby | 1.6 | 0.9 |
| 11 | Wychavon | 1.5 | 0.4 |
| 12 | East Staffordshire | 1.4 | 1.3 |
| 13 | Stafford | 1.3 | * |
| 14 | Sandwell | 1.3 | 1.3 |
| 15 | Tamworth | 1.2 | 0.7 |
| 16 | Warwick | 1.2 | 0.7 |
| 17 | Lichfield | 1.0 | 0.5 |
| 18 | Solihull | 1.0 | 1.8 |
| 19 | Malvern Hills | 1.0 | 0.3 |
| 20 | Wyre Forest | 0.8 | 1.2 |
| 21 | North Warwickshire | 0.8 | * |
| 22 | Walsall | 0.8 | 1.0 |
| 23 | Staffordshire Moorlands | 0.7 | 0.2 |
| 24 | Bromsgrove | 0.5 | 0.7 |
| 25 | Cannock Chase | 0.5 | 0.0 |
| 26 | South Staffordshire | 0.4 | 0.1 |
[*] Missing values
Source: UK Gov
Homelessness is an expensive and rising cost for regions
Homelessness in the UK costs local authorities a significant share of their annual budgets, which in many cases are already in the red with almost 1 in 5 council leaders fearing a section 114 notice (effective bankruptcy).
Birmingham City Council, the council with the largest budget deficit in the UK and recipient of a section 114 notice, is also the council with the highest spend on temporary accommodation (outside London) according to Shelter:
Table 3: Total temporary accommodation spend, top 10 local authorities excluding London (2018/19)
| Rank | Local authority | Total Temporary Accommodation spend (18/19) |
| 1 | Birmingham | £30,558,000 |
| 2 | Manchester | £22,124,000 |
| 3 | Brighton & Hove | £21,661,000 |
| 4 | Luton | £16,254,000 |
| 5 | Milton Keynes | £8,747,000 |
| 6 | Slough | £5,826,000 |
| 7 | Peterborough | £5,525,000 |
| 8 | Northampton | £4,398,000 |
| 9 | Cornwall | £4,173,000 |
| 10 | Chelmsford | £4,135,320 |
Source: Shelter

A tool to predict homelessness
The homelessness prediction tool of WMREDI was developed to foresee how homelessness rises will hit areas across West Midlands at finer geographies than available in published data (e.g. Table 2). The prediction tool relies on what has been known about the likelihood of people experiencing homelessness and is based on data from multiple data sources.
Given the outcomes of the previous analysis performed by ONS in 2018 ‘Past experiences of housing difficulties in the UK: 2018’ and assuming that it is household income that is influential in kick-starting the accumulation of rent arrears, the tool considers five factors that influence the likelihood a person will experience homelessness:
- How many members of the household are employed and can therefore contribute to rent expenses?
- Is it a one-person household?
- Are there dependent children in the household?
- Is a tenant renting privately or is she/he a council tenant?
- What is the median income in the area?
The data fed into the model returns a score for each Parliamentary Constituency in the West Midlands reflecting the homelessness risk. Based on the latest data (2022) the model foresees the greatest risk of rise in homelessness in:
- Coventry North East
- Birmingham Ladywood
- Birmingham Yardley
- Birmingham Erdington
- Birmingham Perry Bar.
Concluding remarks
Homelessness has become a significant issue in the UK in recent years. The impact of homelessness is being felt acutely in the West Midlands and the levers available to address it are in part held by a council in financial crisis.
The WMREDI homelessness prediction tool can help forecast at a very fine spatial scale where homelessness is likely to rise.
This tool can help guide local policymakers to both address and prevent homelessness within the West Midlands.
Data Sources: for the WMREDI homelessness tool
- Annual population survey by ONS, 2020 (households data)
- Survey of personal income by HMRC, 2018-19 (income data)
- Coronavirus Job Retention Scheme Statistics by HMRC, October 2021 (furloughed jobs data)
- Census 2011 (Tenure type data)
- DWP statistics on Universal Credit at postcode level
- Geodemographic Mosaic data to describe family types
This blog was written by Dr Matt Lyons, Research Fellow, and Maryna Ramcharan, Senior Policy and Data Analyst, at City-REDI, University of Birmingham.
Disclaimer:
The views expressed in this analysis post are those of the authors and not necessarily those of City-REDI / WMREDI or the University of Birmingham.
