

On 3 September, we brought together researchers from Universities of Birmingham, Curtin, Strathclyde and the OECD at the University of Birmingham for a meeting of the Regional Economic Modelling Group. Regional economics remains highly relevant to policy, and regional models have an important role in informing evidence-based policy decisions. The workshop was an opportunity to share ongoing research, discuss the difficulties we face and explore how we might address them together.
The six presentations covered work on the UK and Australia, using approaches ranging from input–output modelling to system dynamics. Applications included technological change, US tariffs, major events and the regional distribution of R&D investment.
A System Dynamics Model of the UK Economy for Structural Technological Change
Maryna Ramcharan — City-REDI, University of Birmingham
Maryna discussed the difficulty of modelling technological change when established economic relationships are changing. She proposed a sectorally disaggregated system dynamics model linking production, investment, productivity, labour markets, wages and skills through stocks, flows and feedback. This would capture processes such as training delays and reinvestment that input–output tables do not directly represent.
The first application will examine AI adoption, allowing sectors to differ in adoption speed, whether AI replaces or complements workers, and policy responses. Open questions include how much sectoral detail is useful, which relationships should be determined within the model, and how national analysis might be extended to regions.
Building a Regional Social Accounting Matrix for UK CGE Analysis
Sara Cubilla Juvinel — Fraser of Allander Institute, University of Strathclyde
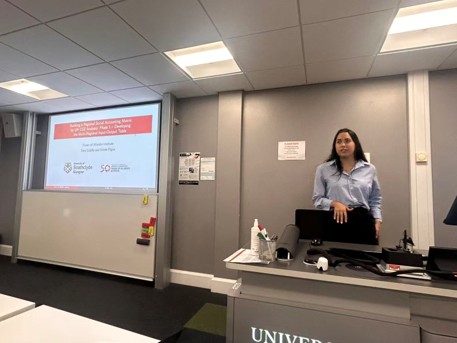
Sara presented work with Gioele Figus on a twelve-region input–output table to support a UK regional computable general equilibrium (CGE) model. It combines ONS regional data with national input–output totals, estimating regional output through constrained optimisation.
A size-adjusted, capped Flegg location quotient estimates how much demand can be supplied locally, while a gravity model allocates purchases from other UK regions using trade, GVA and distance. Cross-entropy minimisation ensures that the accounts balance. Initial validation shows that regional GVA shares closely match official figures and export shares are within roughly two percentage points. The work illustrates how several estimation methods can be combined when direct regional trade data are limited.
AusRIO: A Multi-Regional Input–Output Model for Australia — and Australian Exposure to US Tariffs
Matthew Lyons — Bankwest Curtin Economics Centre, Curtin University
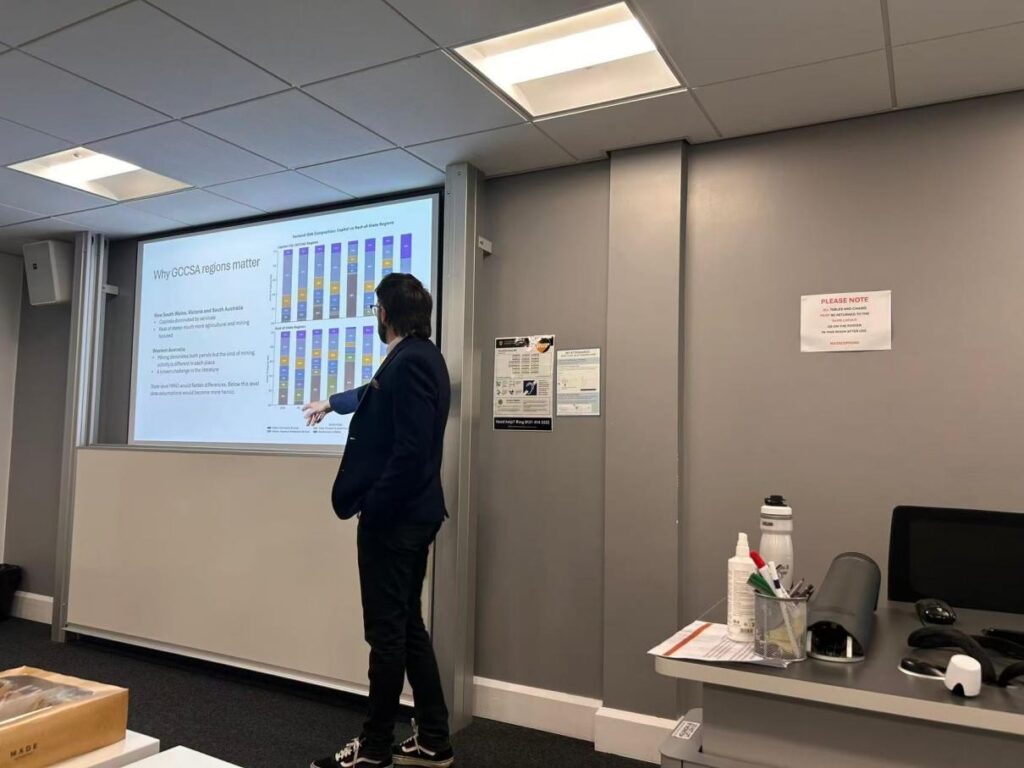
Matt introduced AusRIO, covering 115 industries and 15 Australian regions, separating capital cities from the rest of their states. Built from the Australian Bureau of Statistics’ 2022–23 input–output tables, it captures differences between service-dominated capitals and areas more reliant on agriculture and mining. The model uses CHARM to account for regions both buying and selling goods in the same industry. Income multipliers also show flows towards larger metropolitan economies.
Applied to US tariffs, the model suggests that a 15% tariff would reduce national GVA by A$1.0–1.38 billion and employment by 7,300–9,700 full-time equivalent (FTE) jobs. Sydney and Melbourne face the largest absolute losses, while South Australia outside Adelaide is most exposed relative to its economic size.
Major Events, Dynamic Pricing and Regional Economic Impact
Calvin Jones — Cork University Business School, and City-REDI, University of Birmingham
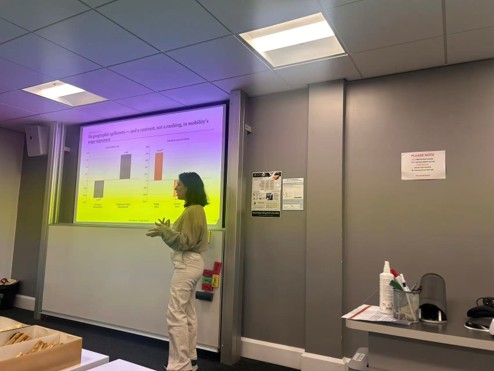
Calvin questioned whether standard event impact methods adequately capture dynamic pricing. His study covered more than 300 events at Cardiff’s Principality Stadium between 1999 and 2025. On event nights, hotel prices rise much more than occupancy, increasing profits with little change in staffing or purchases from suppliers.
He estimated around £16.5 million in additional annual hotel income compared with an average-night baseline. This raises local output and GVA without corresponding employment or supply-chain effects. With many hotels owned elsewhere, income also leaves the region. His estimates put this leakage at around a tenth of the measured impact, before accounting for platform intermediaries and monopoly rights-holders.
Unravelling UK Regional Wage Curves and Worker Mobility
Eleanor Keeble — OECD Science, Technology and Innovation Directorate
Using Understanding Society data for 2010–2023, Eleanor found that a 10% rise in regional unemployment was associated with roughly 0.5% lower real hourly wages. Her individual fixed-effects models covered more than 170,000 person-wave observations, and the unemployment result passed a falsification test using future unemployment. Workers in occupations with high exit rates earned less, with the wage penalty concentrated in moves across industries rather than occupational changes within an industry.
The wage response to unemployment was not statistically distinguishable from zero in London and the Greater South East, but was two to three times larger elsewhere. These differences matter for regional models that assume a uniform wage response. The next phase will incorporate regional elasticities and constraints on worker reallocation across industries into SEIM-UK, then revisit the R&D levelling-up scenario.
‘Levelling Up’ R&D in the UK: A Multi-Region Input–Output Approach
Huanjia Ma — City-REDI, University of Birmingham
Huanjia examined the regional distribution of public R&D. Output multipliers for professional and technical services, and information and communication, were stronger within the Greater South East (GSE). Limited spillovers between regions outside the GSE suggest that concentrating investment in one would bring few benefits to the others.
Modelling a 40% increase in government R&D spending showed that a more equal allocation produced more balanced regional outcomes while retaining similar national output gains.
Further work uses Business Enterprise Research and Development (BERD) microdata to break R&D expenditure into labour, current costs and capital, then map purchases to supplying sectors and regions. This will examine whether R&D outside the GSE depends disproportionately on GSE suppliers.
Where next
Many of the challenges discussed at the workshop were familiar to others in the room. Researchers are building regional accounts from national tables using much the same methods, including location quotients, gravity models and entropy reconciliation, while working around persistent gaps in subnational trade data. Improving these data will require continued collaboration between researchers, policy practitioners and statistical authorities. Sharing methods and experience is also a practical way to improve the models we use to inform regional policy.
We will continue these discussions with colleagues across the modelling community. If you work on regional models and face similar data or modelling challenges, we would be pleased to hear from you.
This blog was written by Huanjia Ma, Research Fellow at City-REDI, University of Birmingham.
Disclaimer:
The views expressed in this analysis post are those of the author and not necessarily those of City-REDI or the University of Birmingham.