 Creative industries have long been a focus of urban researchers and policymakers. There is a good reason for this: creative industries tend to cluster heavily in cities. In the UK, for example, 53% of creative industries jobs and 44% of firms are found in just five cities.
There is a large academic literature describing these location patterns, and linking them back to larger changes in national economies: the shift to post-industrial structures, and a greater demand for ‘experiences’.
For policymakers, though, there are two more urgent questions. How does creative clustering influence urban economies? And how much does the spatial imbalance of creative activity matter?
Creative clusters may simply reflect what’s happening at the national level. However, they may also generate multiplier effects: spending by creative workers may support jobs growth and firm creation, especially in local services like cafes, bars and shops. Or creative activity may add to the pool of ideas in a city, helping innovation and productivity. Other impacts may be less positive. If creative activities draw in high-skill workers and industries, this may drive up the cost of housing, leading to gentrification.
These issues have been extensively debated, so far without any clear conclusions. A number of studies – for example, here and here – find positive linkages between creative industry presence and urban or regional wage growth, employment growth, innovation and wealth. However, it is easy to see how richer cities might support larger creative economies, not vice versa. These puzzles make it harder to design good policy.
Our PEC project hopes to disentangle some of these issues for cities in the UK. Below we share some early findings from the analysis. Please note that this is work in progress, and final results may differ.
We use the Business Structure Database to build a unique 21-year dataset for UK cities, from 1997-2018, which allows us to precisely map the location of creative industries firms and jobs. Because we are interested in urban economies, we work with 78 Travel to Work Areas (TTWAs), which cover cities and their wider commuting zones. We define creative industries using standard government definitions; as other studies have done, we divide the rest of the economy into tradable and non-tradable categories using Locational Gini coefficients. The former includes export-orientated industries like manufacturing and financial services; the latter includes more localised activity like shops, cafes and restaurants, and public sector activity.
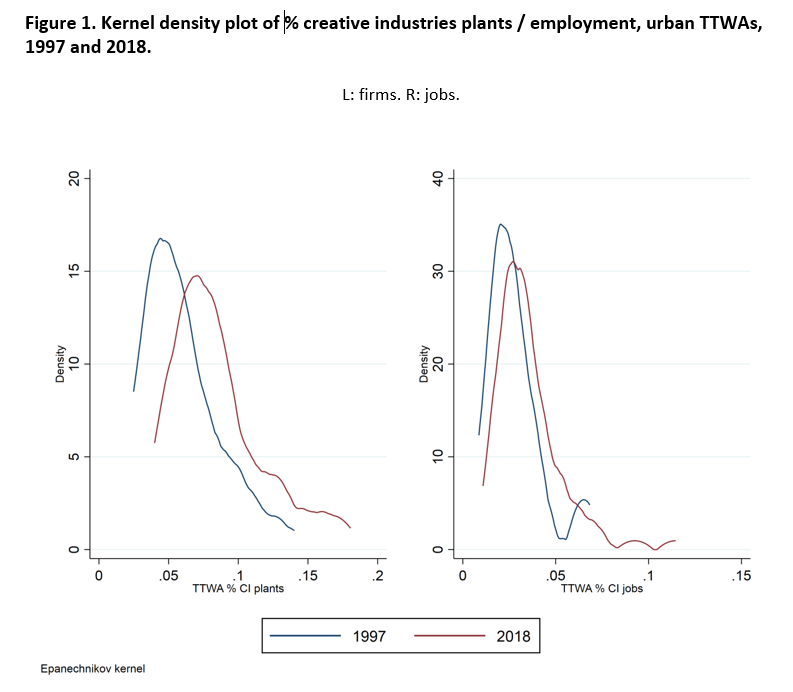
We start by looking at change in creative clusters over time. Figure 1 shows the shares of creative firms (left-hand side) and employment (right-hand side) across all of our TTWAs in 1997 and in 2018. We can see an unambiguous shift rightwards in the distribution, particularly for firms, which means that creative industries activity has become more spatially concentrated over the long term. This is also consistent with work by Bruce Tether for the PEC, and by NESTA, which both show increasing concentration during the 2000s at the regional and city levels.
We also look at the degree of specialisation in creative industries across UK cities. Figure 2 shows the distribution of location quotients (LQs) for creative firms (left-hand side) and jobs (right-hand side) in 1997 and in 2018. An LQ over one indicates an industry is more concentrated in an area than its national share. Here, the graphs show that most TTWAs have LQs below one – the peak of the graphs – with a small number of cities showing disproportionately large creative industries on the right tail of the graph where LQs are much higher than one: as expected, these are largely London and surrounds, but also Brighton, Oxford, Edinburgh, Cambridge and Bristol.
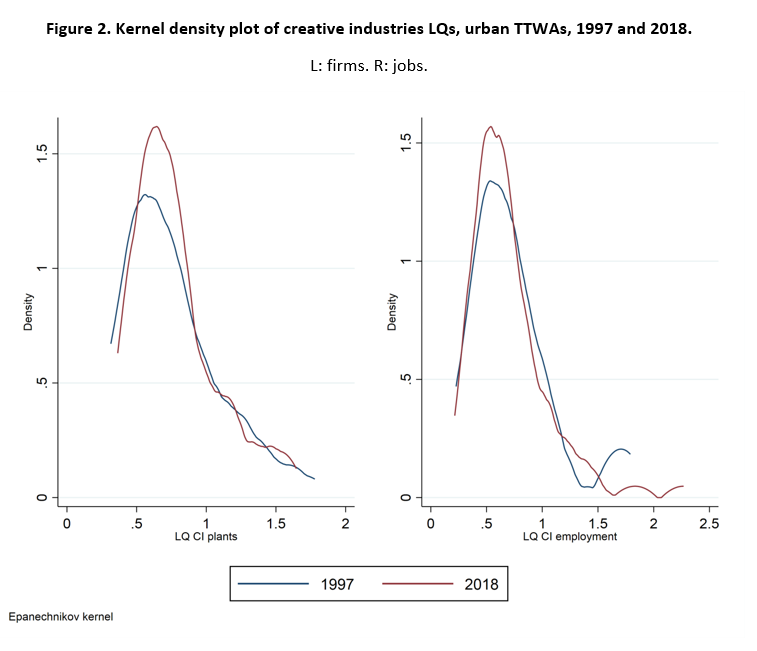
This distribution of the creative industries isn’t a surprise – but other findings are more so. In particular, we can see some important shifts over time. For employment, the cities most specialised in the creative industries in 1997 are now more specialised in 2018 than 20 years before (see the right tail of the employment graph). But at the same time, there are more places with some creative activity than before: the 2018 peaks are higher than the 1997 peaks.
Together, these figures mean that between the late 1990s and late 2010s, we’ve seen a) creative firms and jobs clustering more densely in a small number of urban locations b) the very biggest creative employment clusters have become more specialised c) a shift in creative industry specialisation across the country, with more places with some creative industries than before.
Next, we take a first look at connections between creative industry presence and the wider urban economy. We start by looking at the city-level relationship between creative industries growth and the growth in non-tradable activity (for example, in shops, restaurants and other local services). This tests whether there might be a creative industries multiplier effect – where creative firms and workers’ spending power boosts activity elsewhere in the city. At this stage, we can’t claim any causal link – these graphs simply give a sense of the overall relationship.
Figure 3 shows the change in the number of creative industries firms in UK cities and the change in the number of non-tradable firms in those cities, where each circle is a city. The bigger circles represent bigger cities. The red line shows the overall fit between these two trends, and shows a positive relationship, suggesting a possible multiplier ‘effect’. We can see the influence of London and the largest second-level conurbations (like Birmingham, Bristol and Manchester).
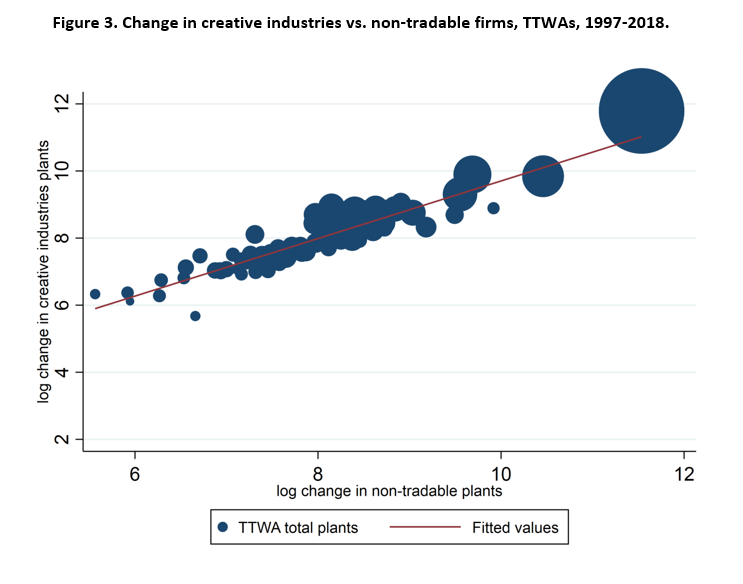
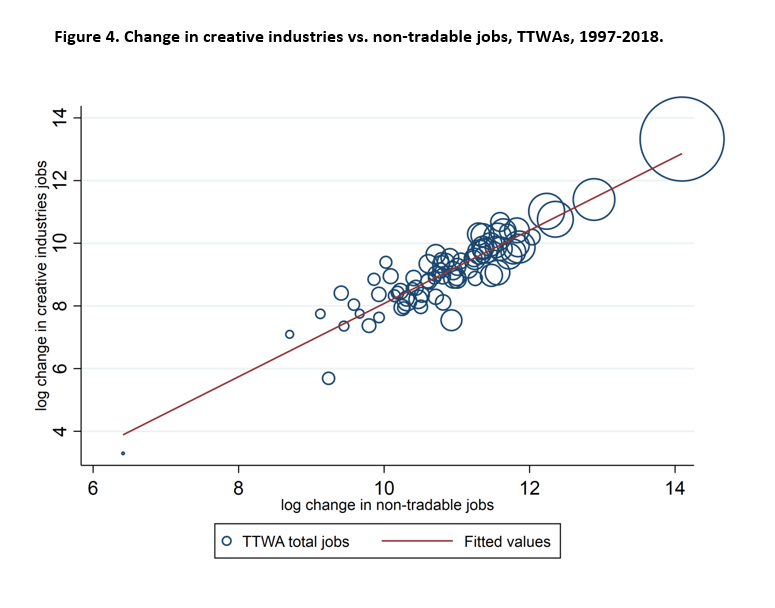
Figure 4 repeats the analysis for employment. Again, we see a positive relationship, suggestive of a multiplier ‘effect’, with London and bigger cities helping drive this.
These first – descriptive – results may be encouraging for policymakers: we see positive associations between the growth of creative industries activity and growth elsewhere in urban economies. And while creative industries are becoming more concentrated, more places than before now have some creative industries activity. However, these findings don’t – on their own – confirm any multiplier ‘effect’. Rather than creative industries driving urban growth, it may turn out that bigger cities with larger and more dynamic economies also support bigger creative sectors.
The next stage of our analysis will dig into these relationships further, and examine whether the creative industries are really a driver of urban economies rather than a feature. We also want to look at wider processes – for example, shifts in urban wages and urban housing costs. Taken together, this should give us valuable insights into the overall effects of the creative industries on economic and social outcomes.
This blog was written by Dr Diana Gutiérrez Posada, Research Fellow, City-REDI and Dr Max Nathan, Associate Professor in Applied Urban Science, Centre for Advanced Spatial Analysis, UCL and a City-REDI Associate.
It was first published by Creative Industries Policy and Evidence Centre (PEC) on 31 January 2020.
Disclaimer:
The views expressed in this analysis post are those of the authors and not necessarily those of City-REDI or the University of Birmingham.
To sign up to our blog mailing list, please click here.