Carolin Ioramashvili explores the gender pay gap among Innovate UK-funded businesses.
STEM (Science, technology, engineering, and maths) industries are notorious for the under-representation of women, as well as ethnic and other minorities. Long seen as “boys” subjects, this under-representation starts from the choice of undergraduate courses and is echoed at higher levels of higher education and in industry. Since 2017, the UK Government mandates businesses with more than 250 employees to report on the gap in earnings between male and female employees, the idea being that exposure of systematically lower earnings for women would encourage businesses to hire more women in higher-paid positions and support women in advancing their careers.
While legislation mandates equal pay for equal work, the causes of pay differences run deeper: women are less likely to advance to higher-paid managerial positions, are more likely to work part-time, and are less likely to work in high-paid industries, such as STEM. Through initiatives such as gender pay gap reporting, the government tries to reduce this gap. It is also a major supporter of STEM research, with the UK’s research capability widely seen as a driver of productivity growth, and investments in innovation promoted as a pillar of the “levelling up” agenda. But do the two overlap? In its own funding allocation, does the government practice what it preaches in terms of supporting women to advance in STEM industries?
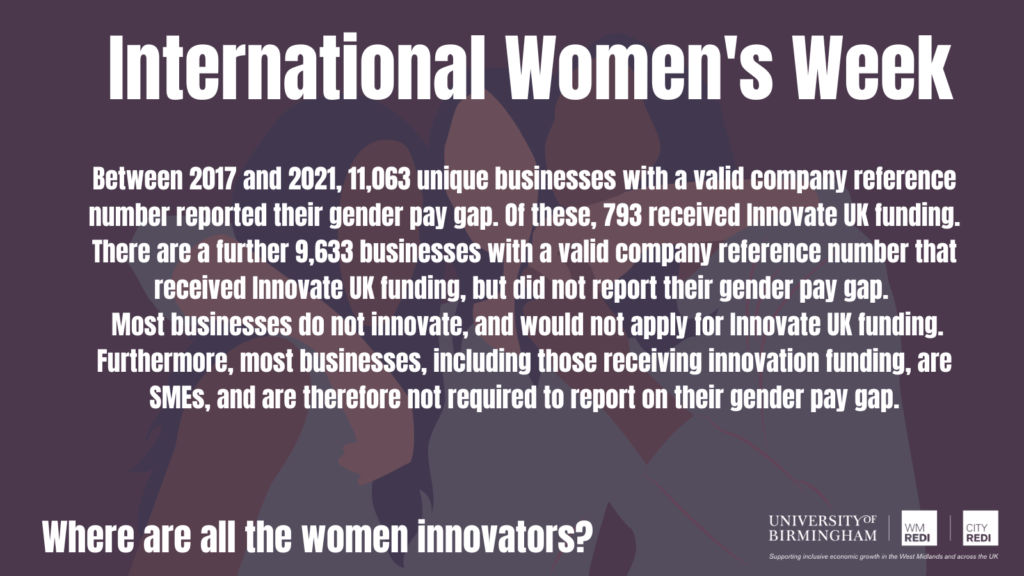
To find out, we can look at the gender pay gap in businesses that have received innovation funding from Innovate UK, the UK’s innovation funding agency. Data on the gender pay gap is available from 2017/18 to 2020/21. To cover a similar period, this is matched to businesses that have received Innovate UK funding between January 2015 and February 2022. Each year, just over 9,000 businesses reported their gender pay gap. The number was substantially lower in 2019/20 at 5,888, possibly because the reporting period at the end of the financial year coincided with the outbreak of the Covid-19 pandemic in the UK.
Innovate UK funding benefits businesses with large gender pay gaps and few women at the top
The gender pay gap reporting collects a number of statistics. In this blog, the focus is on two: the median earnings gap and the share of women in the top earnings quartile. The median earnings gap reports the percentage difference in median earnings between men and women in an organisation. The larger the gap, the higher are median earnings of men compared to women. The share of women in the top earnings quartile indicates the share of women who are among the 25% of highest earners – across genders – within an organisation.
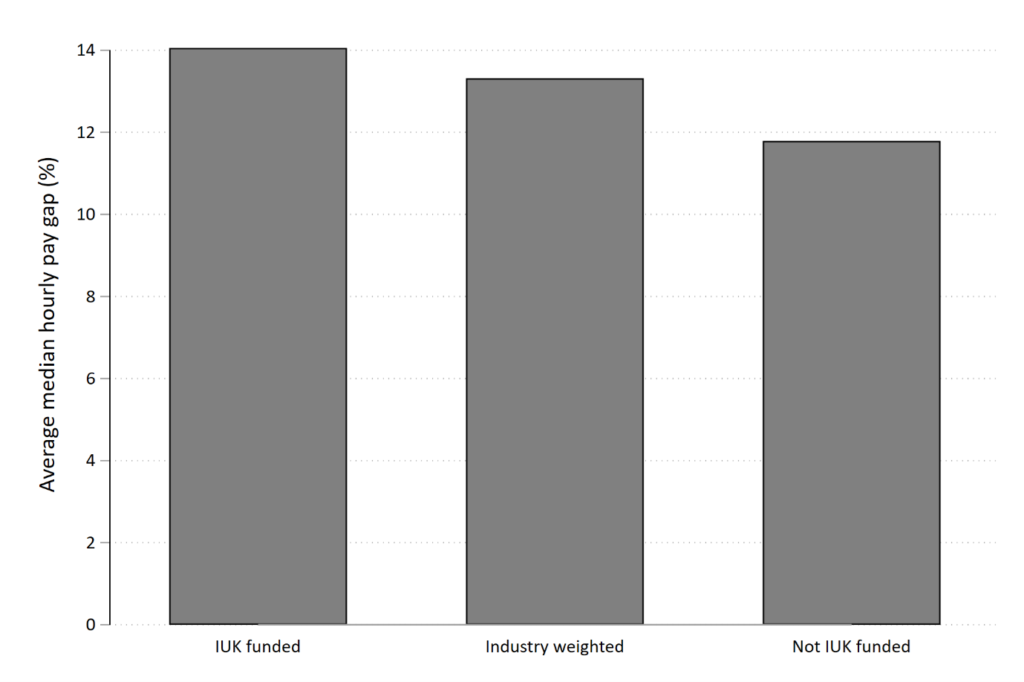
The figure below shows the average gap in median earnings across three groups of firms. The first bar shows businesses that have received Innovate UK funding, while the third shows all businesses that did not receive funding. These are obviously two very different groups of businesses: innovative businesses are more likely to be in manufacturing or high-skilled services industries. To correct for this, the middle bar includes only unfunded businesses but is weighted by the industry mix (measured by 5-digit industrial classifications) observed among the Innovate UK-funded businesses.
Among Innovate UK funded businesses, the median earnings gap is the highest: In these organizations, median male earnings are on average 14% higher than median female earnings. This is slightly lower in the non-funded group that replicates the Innovate UK industry mix, at about 13%, and lowest in the general population of UK businesses, at just under 12%. While high, these differences do not necessarily indicate discrimination. Rather they are likely the result of women occupying lower earning positions within organisations.
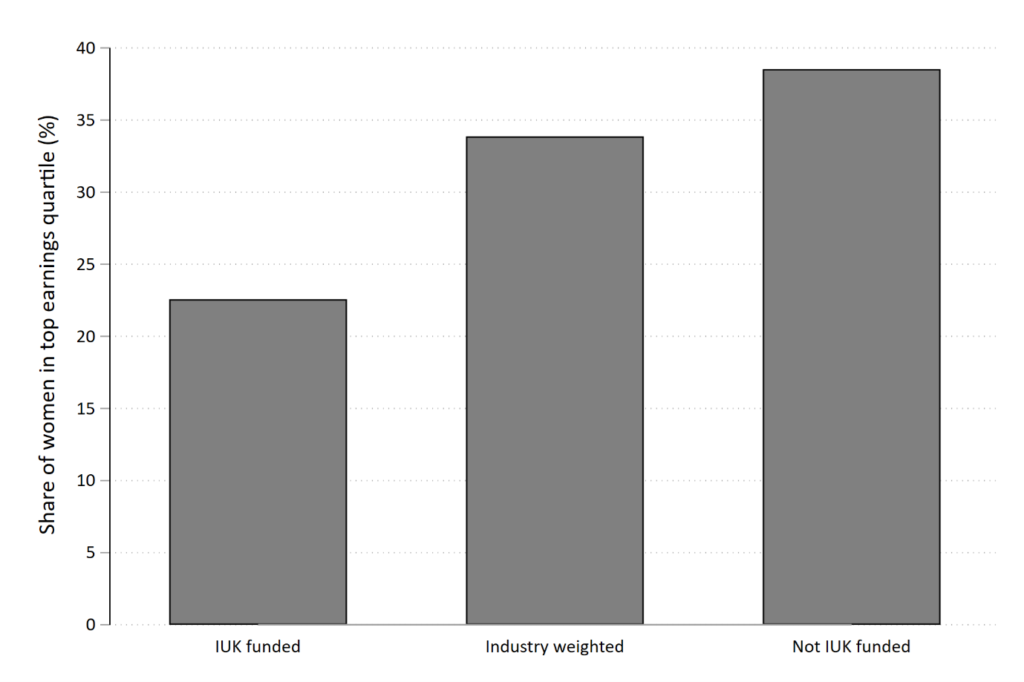
The next figure shows the differences in the representation of women among the highest earners in an organisation. Lower bars mean that there are fewer women among the 25% of top earners in an organisation. This repeats the findings of the figure above. The share of women in the top-earning quartile is only around 23% in Innovate UK funded businesses, just under 35% in the non-funded businesses representing the same industry mix, and around 39% in the general UK business population.
What to do about it? Invest in industries with higher representation of women
Shifting the funding mix towards industries with more representation of women at the top could substantially reduce the gender pay gap in Innovate UK’s portfolio. The table below shows the ten industries (by 2-digit Standard Industrial Classification) with the highest share of women in the highest-earning quartile. The table also includes the average median gender pay gap and the share of Innovate UK funding received by businesses in the industry between 2015 and 2022. This funding share needs to be caveated, as funding is often allocated to consortia of multiple firms. However, from the data published by Innovate UK, it is not possible to discern how much money was received by each firm in a consortium. Therefore, funding is double-counted for businesses operating in consortia. The table also only includes businesses that received Innovate UK funding, where also information on the gender pay gap is available, as only the industry code for these businesses is available.
As the table shows, the industry with the highest share of women at the top – 77% of top earners are women – is the manufacturing of wearing apparel, i.e. the fashion industry. However, the industry, which also has a relatively low overall pay gap of 8%, received only 0.002% of the overall funding made available by Innovate UK. The other industries in the table have a typically high share of women in the workforce, such as health care, education, creative industries, and retail. None of these, except crop and animal production, represents more than 1% of Innovate UK funding.
Table 1: 10 industries with the highest share of top-earning women among Innovate UK funded companies
| Industry | Women in the top earnings quartile | The average median gender pay gap | Share of Innovate UK funding |
| Manufacture of wearing apparel | 77% | 8% | 0.002% |
| Human health activities | 73% | 8% | 0.03% |
| Real estate activities | 51% | 9% | 0.003% |
| Education | 49% | 11% | 0.06% |
| Creative, arts and entertainment activities | 46% | 9% | 0.03% |
| Retail trade, except motor vehicles and motorcycles | 46% | 8% | 0.16% |
| Manufacture of beverages | 45% | -4% | 0.14% |
| Security and investigation activities | 41% | 14% | 0.02% |
| Crop and animal production, hunting and related service activities | 40% | 18% | 3.16% |
| Employment activities | 40% | 26% | 0.02% |
In contrast, the table below shows the five industries that received the most Innovate UK funding between 2015 and 2022, among businesses where gender pay data is also available. All of these are manufacturing industries, with fabricated metal products at the top. These industries, such as car manufacturing, are traditionally male-dominated. Among these industries, the highest share of top-earning women is among manufacturers of electrical equipment, with 33%. The lowest gender pay gap is among car manufacturers, with 4%. However, this industry simultaneously has the lowest share of women in the top earnings quartile, of only 10%.
Table 2: Industries receiving the most Innovate UK funding between 2015 and 2022
| Industry | Women in top earnings quartile | Average median gender pay gap | Share of Innovate UK funding |
| Manufacture of fabricated metal products, except machinery and equipment | 12% | 11% | 29.04% |
| Manufacture of electrical equipment | 33% | 13% | 20.81% |
| Manufacture of other transport equipment | 12% | 11% | 15.68% |
| Manufacture of motor vehicles, trailers and semi-trailers | 10% | 4% | 8.81% |
| Manufacture of computer, electronic and optical products | 13% | 19% | 3.30% |
Of course, the onus of improving the representation of women in innovation is not on Innovate UK alone – businesses themselves need to invest in hiring and supporting women throughout their careers. But the picture above reinforces the suspicion that male-dominated industries are somehow more “important”, more “serious”, and more deserving of support by the government. This needs rethinking: The UK is world-leading in the creative industries, the shows at London fashion week influence trends around the world, with major luxury brands contributing to the UK’s export base, and medical researchers from the UK developed one of the leading Covid-19 vaccines. Innovate UK could support these highly successful and innovative industries, while also contributing to lowering the gender pay gap across the UK economy.
This blog was written by Dr Carolin Ioramashvili, Research Fellow, at City-REDI / WMREDI, University of Birmingham.
Disclaimer:
The views expressed in this analysis post are those of the authors and not necessarily those of City-REDI, WMREDI or the University of Birmingham.