 The Office of Budget Responsibility’s (OBR) COVID-19 analysis published on 14th April 2020 makes clear that on the basis of evidence from past pandemics the economic impact of the crisis will arise less from illness and death than from the reduction in demand for goods and services stemming from public health restrictions and social distancing in the transition to ‘normality’. An OBR scenario based on an assumption of a three-month lockdown (restricting people’s movements and economic activity) followed by three months of partial restrictions in the transition to normality yields a 35% reduction in GDP in Q2 2020 (April to June), following growth of 0.2% in Q1 2020. Under these assumptions the yearly contraction of the UK economy of 12.8%.
Table 1: OBR scenario output losses by sector in Q2 2020
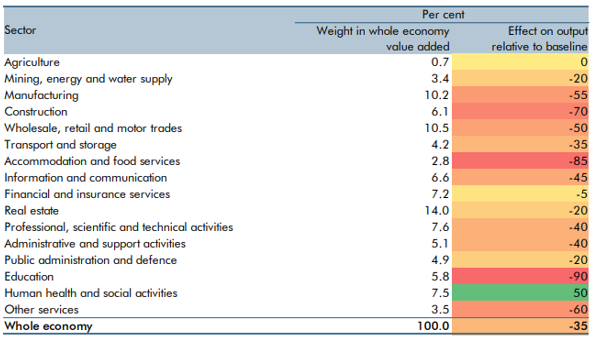
The sectors showing the largest relative output reductions in this scenario are Accommodation & food services and Education, followed by Construction, and then Other services, Manufacturing and Wholesale & retail (see Table 1). Only the Human health & social work activities sector – which is taking the brunt of the human impact of the COVID-19 pandemic – emerges economically unscathed, with an increase in output under this scenario.
The Centre for Progressive Policy (CPP) has undertaken analyses of the variations in impacts at local authority level. The analyses are based on the assumption that the sectoral impacts are the same locally as they are nationally (although in reality, this need not necessarily be the case). Hence the local impacts of the OBR scenario represent are a function of the distribution of each local authority’s GVA by sector.
Across local authorities, in the West Midlands (NUTS 1) region the estimated decline in GVA in Q2 2020 is shown in Figure 1. Local authorities with a greater estimated reduction in GVA than the national average are shown in red, while those with a smaller than national average estimated reduction are shaded green. Birmingham’s estimated reduction in GVA is the same as the national average (35%). The local authorities with the largest estimated declines in GVA in the West Midlands and Stratford-upon-Avon, Tamworth, North Warwickshire and Rugby. With some exceptions, several of the larger local authorities tend to have amongst the smaller estimated reductions in GVA. A key factor here in stronger performance is the size of the health sector, which drives stronger performance.
Figure 1: Estimated percentage decline in GVA Q2 2020, local authorities in the West Midlands

Note: Great Britain rankings are shown in brackets after the local authority name (with ‘1’ being the local authority with the greatest estimated decline and ‘382’ being the local authority with the smallest estimated decline)
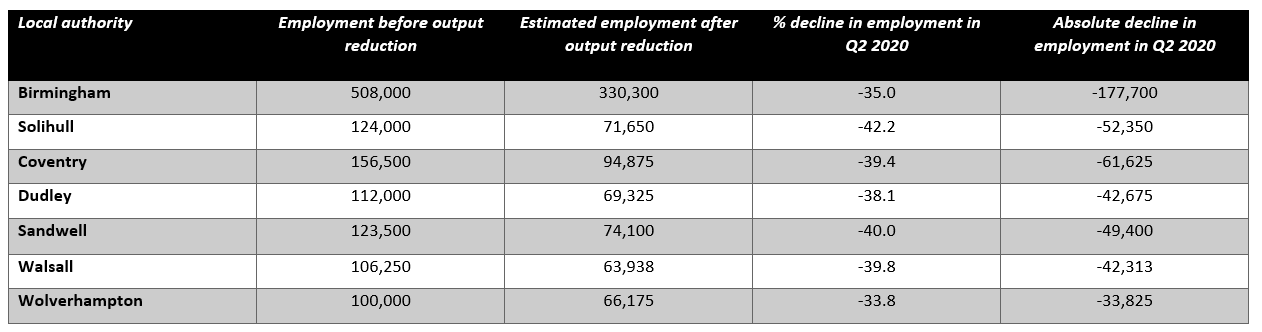
Further analyses by Tasos Kitsos at WM REDI has replicated the CPP results for GVA and translated them into employment impacts for in Q2 2020. The results for the seven metropolitan authorities at the heart of the West Midlands are shown in Table 2. Of these local authorities Solihull displays the largest estimated percentage decline in employment (42.2%), with Sandwell, Walsall and Coventry all recording estimated declines of between 39.4% and 40.0%. Wolverhampton displays the smallest relative reduction in employment at 33.8% followed by Birmingham with a reduction of 35%.
Table 2: Estimated employment impacts in Q2 2020 associated with output decline, West Midlands metropolitan local authorities.
It is worth reiterating here that these estimates are based on assumptions here that output and employment reductions by the sector are the same locally as nationally and that productivity within a sector is uniform across local authorities. Based on these assumptions, the sectoral profiles of estimated employment reductions in Birmingham and Solihull are shown in Figures 2 and 3. Given that the national sectoral reductions are translated to the local scale it is unsurprising that the sectoral patterns are similar across these two local areas.
Figure 2: Estimated employment reductions in Birmingham in Q2

Figure 3: Estimated employment reductions in Solihull in Q2
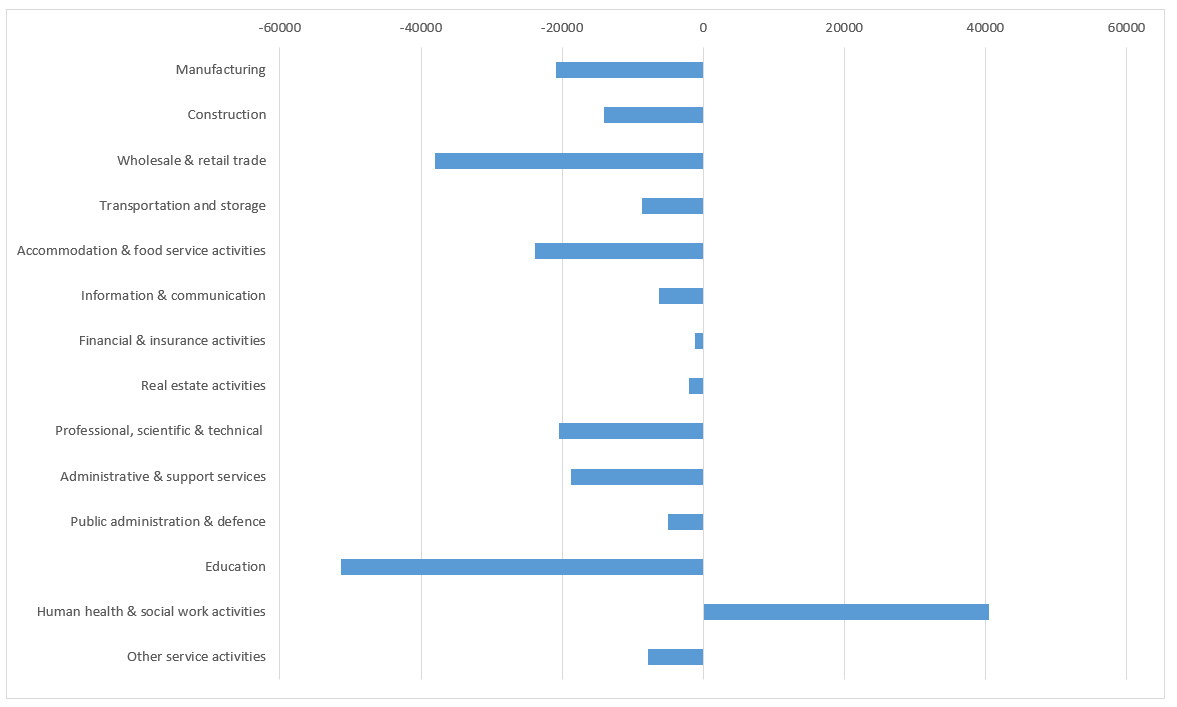
Given that the national sectoral reductions are translated to the local scale it is unsurprising that the sectoral patterns are similar across these two local areas. However, the greater relative sizes of the education sector and wholesale & retail sector in Birmingham relative to Solihull is apparent, while administrative & support services and manufacturing account for a relatively greater share of the absolute losses in Solihull relative to Birmingham.
City-REDI / WM REDI have developed a resource page with all of our analysis of the impact of Coronavirus (COVID-19) on the West Midlands and the UK. It includes previous editions of the West Midlands Weekly Economic Monitor, blogs and research on the economic and social impact of COVID-19. You can view that here.
This blog was written by Professor Anne Green, Professor of Regional Economic Development, City-REDI / WM REDI, University of Birmingham.
Disclaimer:
The views expressed in this analysis post are those of the authors and not necessarily those of City-REDI or the University of Birmingham.
To sign up to our blog mailing list, please click here.