Alice Pugh summarises where Levelling Up funding has been spent so far, across both rounds of funding.
In total across both rounds of the Levelling Up fund, £3.9bn has funded 216 projects. The aim is to understand whether funding was spent in the areas most in need of levelling up.
Regional Analysis
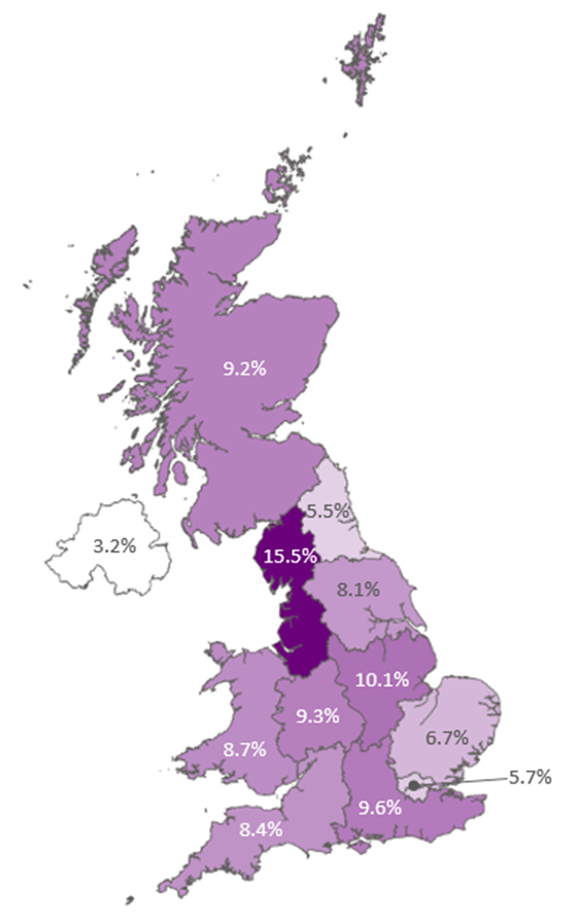
Across both funding rounds, the regions which received the most funding were the North West (15.5%), East Midlands (10.1%) and the South East (9.6%). Regions which have won the least funding so far were Northern Ireland (3.2%), London (5.7%) and the North East (5.5%).
Figure 1: Allocation of Levelling Up funding by region, round one and two
Spend per Capita
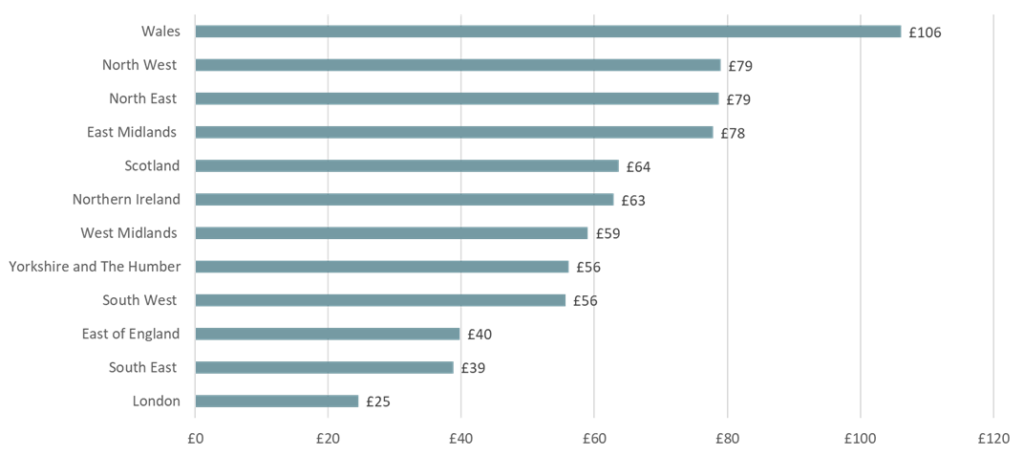
Overall, across both rounds, Wales had the highest spend per capita at £106. The North West and North East both had the second largest levelling up spend per capita at £79. They were closely followed by the East Midlands at £78. Whilst the South East, generally considered to be a more ‘levelled up’ region, was allocated more funding than the North East, per capita it received less funding.
Figure 2: Levelling Up Spend per Capita by Region, round one and two
Political Party Divide
Overall, across both rounds of the 216 projects that have been awarded, 98 have been in Conservative constituencies, winning £1.8bn or 49.8% of total funding. In comparison, 70 projects that received funding were in Labour constituencies, winning £1.2bn or 33% of total funding. The rest of the funding was largely won by other parties (including in Scotland and Northern Ireland). 13 projects were multi-locational and spanned a number Local Authorities (LAs) with different party-political affiliations.
Figure 3: Funding allocated by political party based on the location of the winning project, round one and two
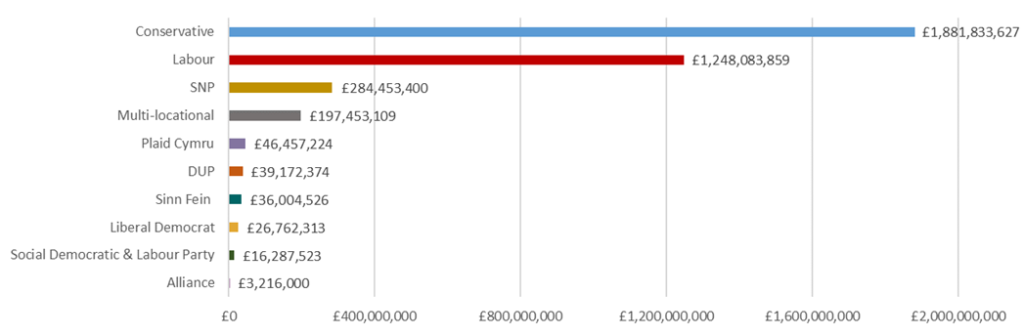
In round one the funding was relatively evenly distributed by political party affiliation; in round two there was a shift towards funding being awarded to projects based in Conservative constituencies. This is being reviewed by the inquiry into Levelling Up.
Indices of Multiple Deprivation
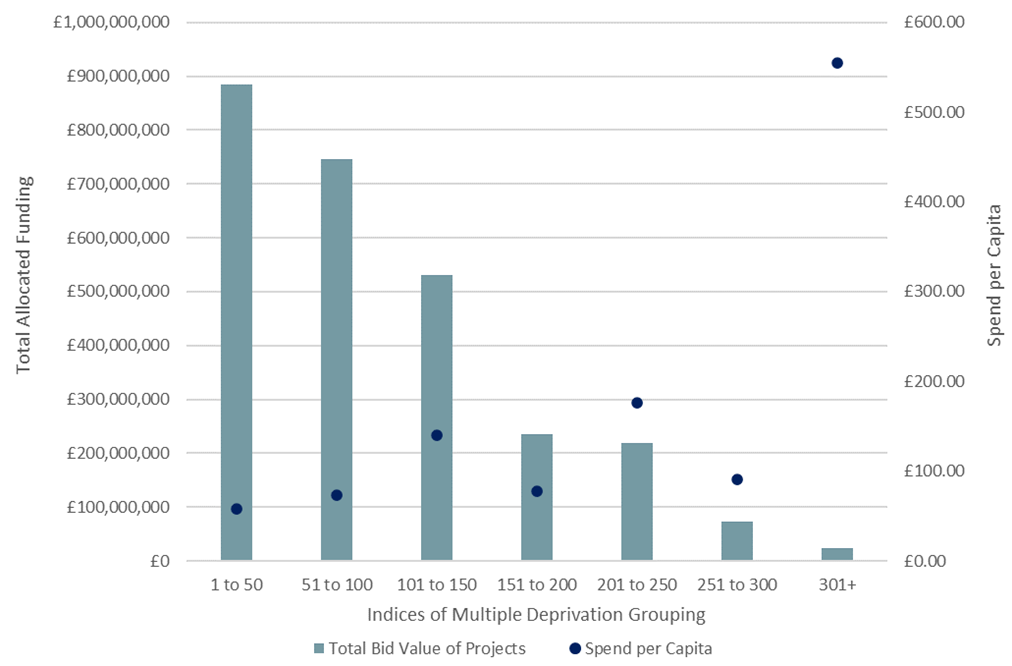
At a more spatially-disaggregated level, the graph below shows the distribution of funding by Indices of Multiple Deprivation rank grouping. The data used in this graph does not include funding awarded to Scotland, Wales or Northern Ireland.
The graph below looks at funding by Indices of Multiple Deprivation grouping across both rounds of levelling up funding. The most deprived group (1 to 50) did receive the most funding in England at 32.6% of funding awarded to LAs in England. However, the 50 most deprived LAs saw the lowest spend per capita at £57.75. Whilst LAs in the least deprived group (301+) received the least funding at 0.8%, they had the highest spend per head of £554.62. The overall trend is that whilst more deprived areas won most of the funding, per capita they received less funding.
Figure 4: Allocation of funding and Spend per Capita by LA Indices of Multiple deprivation ranking, round one and two
Has funding been spent in areas most in need of levelling up?
Overall, across both rounds, whilst most of the funding did go to ‘left behind’ regions, it did not necessarily go to the most ‘left-behind’ areas within them. For instance, for those in the least deprived LA grouping (Figure 4), 300+ had a per capita spend of £544.62, whilst LAs in the most deprived grouping (1 to 50) had the lowest spend per capita of £57.75.
View more Levelling Up work from WMREDI.
This blog was written by Alice Pugh, Policy and Data Analyst for City REDI and WM REDI.
Disclaimer:
The views expressed in this analysis post are those of the authors and not necessarily those of City-REDI or the University of Birmingham.