Our first guest blog from Patrick Willcocks, policy commentator focused on cities and their economic and environmental policy issues (UrbanPivot); a teaching fellow at the UoB Business school focusing on Europe and regional development and a private consultant working on EU funding and policy.
 A couple of things triggered this blog post – my inaugural post for CityREDI. There has been much talk about the re-bounce of Manufacturing; the reshoring of the sector since the recession in the late 2000’s in the UK. I wanted to look at what role Greater Birmingham had taken in this rebirth – to see if manufacturing in the area is such a great driver as it used to be in times gone past.
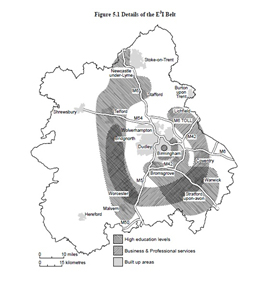
I also wanted to revisit albeit partially the work – now 10 years on of John Bryson et al on the ‘The Functioning Economic Geography of the West Midlands’. John is the key driver behind the establishment of CityREDI and its first Director. His work from 2006 shone a light on the dynamics of change in the region’s economy and introduced the concept of the E3I belt. The growth of enterprise and industry in a broad band of towns around the core metropolitan area of the West Midlands. The availability of GVA data at LEP level compared to data at NUTS2 level allows some quick and dirty analysis to see whether some of the trends identified are continuing.
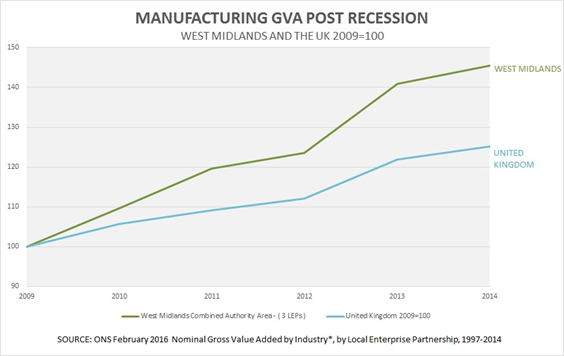
So let’s look quickly at how manufacturing has fared in the UK and Greater Birmingham – focusing on the post-recession period from 2009 onwards. The graph below shows indices of manufacturing GVA for both the UK and the West Midlands Combined Authority – 3 LEP area [1].
This shows that Greater Birmingham/West Midlands is indeed pulling its weight in the Manufacturing renaissance. The UK’s manufacturing GVA has grown by 25.2% but the West Midlands has seen an impressive 45.5% growth.
So let us look now at which areas within the conurbation are driving this growth. The work by John Bryson – a summary presentation can be seen here shows the presence of an economic engine of growing importance for the wider West Midlands. They found specifically that there was a new spatial patterning of production developing within the region with a number of important elements: these included.
- The decline of the Black Country manufacturing sectors
- The continued contraction of the automotive complex in Coventry and the south east of the region.
- The extension or spreading of manufacturing from the conurbation into a surrounding 20km to 40km E3 I belt.
 This helped enormously in developing the geographic focus of the then Regional Development Agency – Advantage West Midlands. It is hoped that the work of City REDI will be equally or more influential in informing policy development at the Combined Authority and Midlands Engine level.
The availability of data at both NUTS2 level as well as LEP level allows for some quick analysis. The West Midlands Combined Authority is defined in two geographic levels. The wider – but not formal 3 LEP level – ie the combination of Greater Birmingham and Solihull LEP with the Black Country LEP and the Coventry and Warwickshire LEP and the core official WMCA area relating to the 7 metropolitan districts. The subtraction of the core area from the wider area figures will allow us to look at a partial representation of the E3I belt – what is called the Periphery in this blog post.
Looking at the GVA figures for these geographies in the graph below we see where the impetus for growth has been in Greater Birmingham.
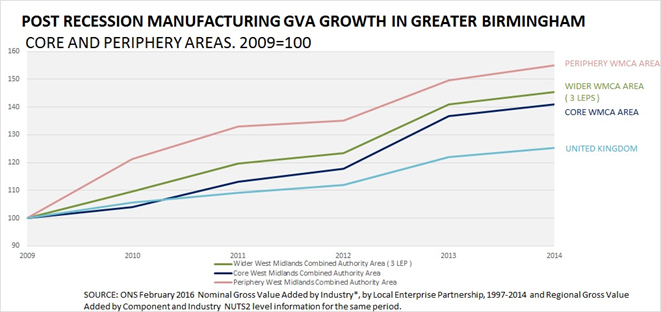
What is clear straight away is that all areas graphed have stronger growth in manufacturing than the UK figures – which stood at 25.2%. What is clear as well is that the growth in the periphery of the WMCA area is significantly higher at 55% than that of the core area which stood at 40.9%. So the trends in Manufacturing identified within the earlier work on the E3I belt seem still to be present – even if the periphery is only growing at a faster rate – ie a relative rather than absolute shifting of manufacturing.
Looking at this in more detail –
| WMCA | Growth in Manufacturing GVA 2009-2014 |
| Core Area | 40.9% |
| Core Sub Areas | |
| The Black Country | 34.9% |
| Birmingham and Solihull | 41.7% |
| Coventry | 57.9% |
It is clear that all areas of the core WMCA have contributed to the growth – with all areas growing faster than the UK figures but the Black Country is growing more slowly than Birmingham and Solihull and has significantly less growth than that of Coventry. There again is no absolute decline but just relative shifts.
Conclusions
So we have a picture of growth in Manufacturing across Greater Birmingham – with the area more than pulling its weight in national terms but with a shifting of manufacturing through faster relative growth towards the periphery and within the core towards Coventry. In terms of share of manufacturing within the wider WMCA area – the percentage share of GVA of the core metropolitan area has fallen from 71.3% in 1997 to 65.2% in 2014.
[1] There are three geographies that I use in this blog post to describe different elements of Greater Birmingham/the West Midlands Conurbation. 1) West Midlands Combined Authority – 3 LEP area – comprising of the Black Country LEP, Greater Birmingham and Solihull LEP and Coventry and Warwickshire LEP 2) The Core of the WMCA area – namely the 7 metropolitan boroughs. 3) The periphery of the WMCA area – ie the 3LEP area minus the Core – namely Warwichkshire, Bromsgrove,Redditch and Wyre Forest in Worcestershire and Cannock Chase, Lichfield, Tamworth and East Staffordshire in Staffordshire. Figures for the NUTS1 region are not used in this blog post.