The latest edition of REDI-Updates is out now - providing expert data insights and clear policy guidance.

In this edition, the WMREDI team investigates what factors are contributing to the cost-of-living crisis and the impact it is having on households, businesses, public services and the third sector. We also look at how the crisis in the UK compares internationally.

Maryna Ramcharan, Annum Rafique and Alice Pugh discuss the impact of rising prices on households and how those on lower income levels are being disproportionately affected.

View REDI-Updates.
Introduction
Households have been severely impacted by the cost-of-living crisis, as inflation rises at almost double the rate of wages. The main inflationary areas which are impacting households have been food, energy, fuel and rent. Food prices have rapidly increased due to the invasion of Ukraine, Brexit and climate change impacting crop yields, energy prices have shot up as a result of the Ukrainian invasion, this is the same for fuel prices except fuel prices are now also being impacted by reductions from OPEC and following the mini budget and ensuing hikes in interest rates rents and mortgages have skyrocketed. Households are being squeezed on all fronts. The purpose of this chapter is to understand how severely households are being impacted in these areas.
Increases in household expenditure in 2022
Due to the cost-of-living crisis, the regions in the UK saw an 11-12% rise in weekly household expenditure. Northern Ireland faced the highest increase in weekly spending from 2021 to 2022 at 12% (£57.31), whereas London only saw a weekly increase of 11.2% (£75.65). Still, since London’s weekly expenditure is much higher than the other regions in the UK, the increase is more than in other regions in absolute terms. Table 1 presents the weekly expenditure for UK regions (2021-2022).
Table 1: Weekly expenditure of UK regions (2021-2022)
| Weekly expenditure in 2021
(£) |
Weekly expenditure in 2022
(£) |
Weekly increase in expenditure in 2022
(£) |
|
| Scotland | 485 | 542 | 57 |
| N. Ireland | 478 | 535 | 57 |
| Wales | 491 | 549 | 58 |
| North East | 459 | 514 | 55 |
| North West | 508 | 567 | 59 |
| Yorkshire and Humber | 477 | 532 | 56 |
| East Midlands | 540 | 604 | 64 |
| West Midlands | 507 | 566 | 59 |
| London | 669 | 744 | 75 |
| East | 572 | 639 | 67 |
| South East | 665 | 741 | 76 |
| South West | 574 | 641 | 67 |
| England | 552 | 616 | 64 |
| United Kingdom | 536 | 598 | 62 |
Food Prices
Since 2021, the cost of living in the UK has been steadily increasing due to higher consumer demands, increases in energy prices and bottlenecks in the supply chain. Table 2 shows the average increase in some staple food items in the UK.
Table 2: Cost of selective food items in the UK from March 2019 to March 2023
| Item (pence) | March 2019 | March 2020 | March 2021 | March 2022 | March 2023 |
| White loaf, 800g | 109 | 107 | 109 | 114 | 138 |
| Margarine, per 500g | 155 | 148 | 138 | 190 | 216 |
| Eggs, per dozen | 230 | 224 | 208 | 247 | 317 |
| Milk, per pint | 44 | 43 | 42 | 50 | 70 |
| Tea bags, per 250g | 205 | 209 | 204 | 215 | 246 |
| Instant Coffee, per 100g | 309 | 311 | 294 | 307 | 332 |
| Sugar, per kg | 76 | 73 | 68 | 78 | 103 |
| Apples, per kg | 200 | 188 | 215 | 216 | 212 |
| Bananas, per kg | 94 | 90 | 79 | 90 | 104 |
| Grapes, per kg | 402 | 391 | 399 | 378 | 425 |
| Potatoes, per kg | 131 | 132 | 132 | 125 | 138 |
| Tomatoes, per kg | 221 | 205 | 236 | 270 | 323 |
| Broccoli, per kg | 174 | 186 | 169 | 170 | 225 |
| Onions, per kg | 85 | 78 | 83 | 83 | 100 |
| Mushrooms, per kg | 291 | 299 | 308 | 329 | 350 |
| Chicken, per kg | 276 | 250 | 267 | 298 | 373 |
| Sausages, per kg | 493 | 490 | 515 | 542 | 661 |
| Ham 100 – 125g | 184 | 191 | 195 | 226 | 254 |
| Beef mince, per kg | 668 | 656 | 600 | 678 | 812 |
| Total | 4347 | 4271 | 4261 | 4606 | 5399 |
| Y on Y % change | -1.7% | -0.2% | 8.1% | 17.2% | |
| % change between March 2019 and March 2023 | 24.2% | ||||
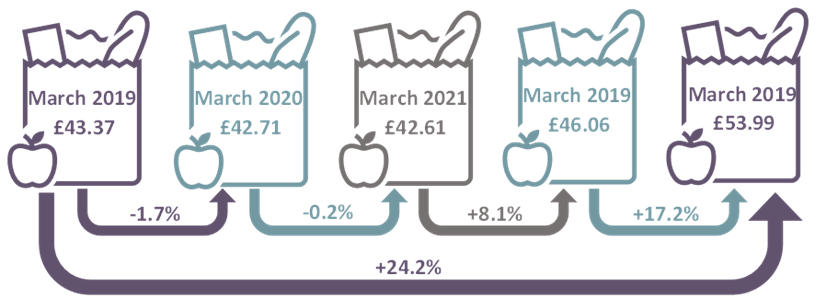
There has been a significant increase in the cost of consumer goods from 2021 to 2023 this is due to significant rises in input costs that producers have faced and as a result have had to pass these price rises onto consumers. For instance, between March 2021 and 2023, the price of milk has risen 66.7%, margarine 56.5%, eggs 52.4%, sugar 51.5%, chicken 39.7%, tomatoes, 36.9%, minced beef 35.3%, broccoli 33.1%, Bananas 31.6%, Ham 30.3%, sausages 28.3%, white bread 26.6%. Between March 2021 and 2023 the price of this shop has increased 26.7% or £11.38 per week; over a year this will mean an extra £591.76. However, this shop only includes basic goods, it does not include cooking oil, herbs, and spices and it does not include the energy needed to cook this food.
Energy Prices
From July 2021 to July 2022, electricity costs rose by 49%, and gas prices increased by 94%. The increase in energy prices was a result of lower production of natural gas, increasing demand for gas after COVID-19 restrictions were lifted and the ongoing conflict in Ukraine, which led to an increase in oil prices. The average annual household expenditure on electricity and gas for 2021 and 2022 is presented in Table 3.
Table 3: The average annual household expenditure on electricity and gas for UK Regions (2021-2022)
| Electricity Cost (£) | Gas Cost (£) | Percentage increase | ||||
| 2021 | 2022 | 2021 | 2022 | Electricity | Gas | |
| Scotland | 778 | 1,146 | 561 | 1,119 | 47% | 99% |
| N. Ireland | 699 | 875 | 0 | 0 | 25% | 0% |
| Wales | 800 | 1,194 | 567 | 1,153 | 49% | 103% |
| North East | 757 | 1,131 | 545 | 1,086 | 49% | 99% |
| North West | 753 | 1,165 | 558 | 1,135 | 55% | 103% |
| Yorkshire and Humber | 756 | 1,147 | 547 | 1,119 | 52% | 105% |
| East Midlands | 750 | 1,147 | 545 | 1,112 | 53% | 104% |
| West Midlands | 766 | 1,172 | 558 | 1,131 | 53% | 103% |
| London | 777 | 1,182 | 583 | 1,193 | 52% | 105% |
| East | 772 | 1,181 | 555 | 1,133 | 53% | 104% |
| South East | 791 | 1,199 | 565 | 1,131 | 51% | 100% |
| South West | 798 | 1,190 | 577 | 1,143 | 49% | 98% |
| England | 769 | 1,168 | 559 | 1,131 | 52% | 102% |
| United Kingdom | 767 | 1,144 | 513 | 1,038 | 49% | 94% |
Source: Department for Energy Security and Net Zero, 2023.a.
The total amount of gas and electricity costs paid by the households depends on the amount of consumption, the type of payment method, and the unit rate and standing charges according to the geographic location. Therefore, we see different energy costs for different regions in the UK, where Northern Ireland had the lowest average annual electricity cost of £699, and Wales paid the highest cost of electricity, which was £800 in 2021. The highest gas cost in 2021 was in London (£583), which rose to £1,193 in 2022, whereas North East and East Midlands had the lowest gas cost of £545 in 2021, which rose to £1,086 and £1,112 in 2022, respectively.
Fuel Prices
The latest average UK fuel prices for one litre, as of 14 March 2023, are 147.28p for petrol and 166.05p for diesel, according to the RAC (Tooze, 2023). Fuel prices in the UK reached record highs in 2022, with the average price of petrol hitting 191.53p and diesel reaching 199.05p in July.
Figure 1: Typical retail prices of petroleum products, UK.
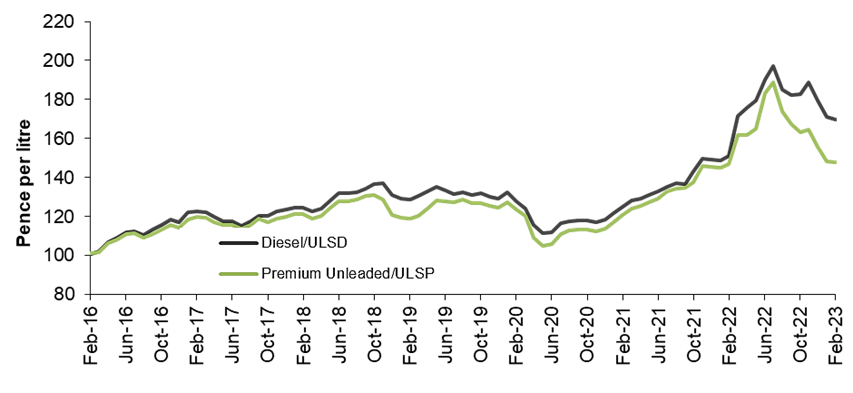
Although fuel prices in the UK have fallen in recent months, there is now a considerable difference between petrol and diesel prices – currently 18.81p a litre. The RAC has warned that diesel prices are likely to go up again following a recent announcement by the oil producer group OPEC+ that it would be cutting oil production by two million barrels a day (RAC, 2023.a).
This could lead to diesel prices heading back to 190p, according to RAC fuel spokesperson Simon Williams (RAC, 2023.b). It spells bad news for drivers amid the cost-of-living crisis, which has seen inflation soar above 10% for the second time this year.
Despite there being just a 6p difference between the wholesale prices of both diesel and petrol throughout all of February, diesel pump prices are currently a colossal 20p more than petrol. This means anyone filling a diesel car is, the RAC calculates, paying around £7 more per tank than they should be if diesel was being sold at a fairer price of around 155p a litre (RAC, 2023.a).
In terms of annual costs of petrol, a typical driver would spend around £29.80 more on diesel at current prices than they did in January 2022. The rise affects households disproportionally, as households with more than one car on average drive more than those with only one car. According to the National Travel Survey (Department for Transport, 2022), households with two or more cars drove 4,648 miles per year on average while households with one car drove 551 miles. Under the assumption that these mileages have remained the same, households with two or more cars would have spent around £61.90 more on diesel at current prices (as they were in March 2023) compared to what they spent in January 2022.
Table 4: Average change in cost of petrol, March 2023 to January 2022. The average change in the cost of petrol has been constructed from the data on average mileage, average fuel consumption and retail fuel prices.

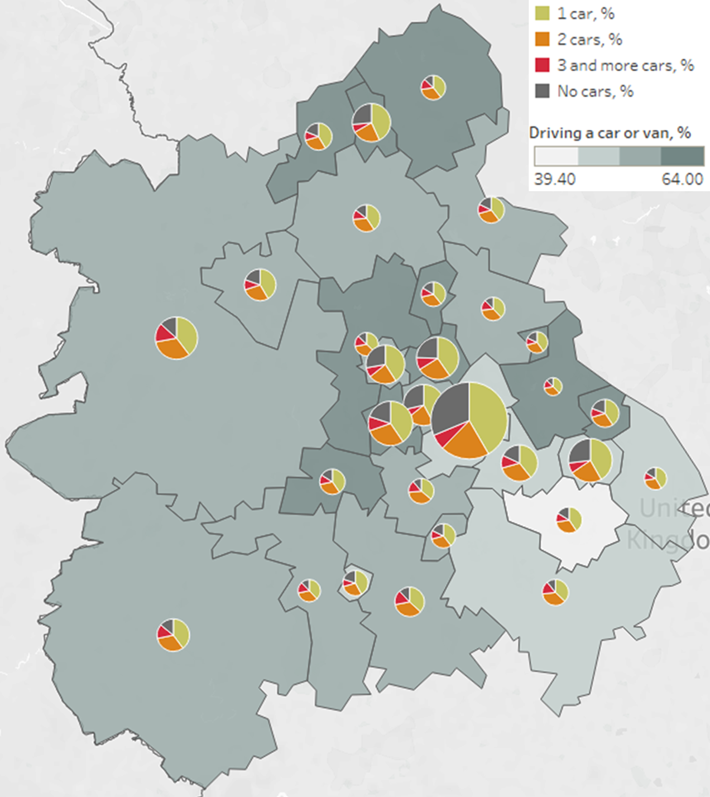
There are 289.3K households with one or more cars in Birmingham alone where 42% of households own only one car or a van, 21% of households own two cars, and 6% of households own three or more cars. This proportion is similar in all local authorities across West Midlands, where one-car households make up around 40% of all families. However, for households living in rural areas, there is more likely to be access to more than one car. On the contrary, the lowest percentage of non-driving households live in big cities, such as Birmingham (31.7% households with no vehicles), Coventry (27.6% non-driving households), Wolverhampton or Sandwell (28.5% and 29.2% respectively).
In total, there are 1.4M people who travelled to work by driving a car or van in the West Midlands (54.6% of all usual residents aged 16 years over in employment) and 133.8K people travelled as passengers in a car or van (4.9%). The estimated percentage of people who drive a car or van to work in the West Midlands (54.6%) was greater than in England (44.5%).
Cannock Chase had the largest percentage (64%) of those who drove to work within all English local authorities. This was closely followed by Staffordshire Moorlands (60.9%) and Wyre Forest (59.9%).
Figure 2: Method travelled to work and Car and van availability in the West Midlands.
Rent Prices
Annual private rental prices increased by 4.5% in England, 4.2% in Wales and 4.9% in Scotland in the 12 months to February 2023 (ONS, 2023). Within England, the East Midlands saw the highest annual percentage change in private rental prices in the 12 months to February 2023 (4.9%), while the West Midlands saw the lowest increase (4.0%). London’s annual percentage change in private rental prices was 4.6% in the 12 months to February 2023.
Table 5: Index of Private Housing Rental Prices – Annual Percentage and Table 5: Privately renting households, monthly estimates.

The increase in annual private rental prices has likely affected 95.7K private renters in Birmingham, 33.2K private renters in Coventry, 24.4K people in Shropshire, 24.2K people in Sandwell, and 20K in Wolverhampton.
However, the increase in rental prices affects private renters disproportionally depending on their earnings and incomes. Thus, private renters with a median household income in the West Midlands could expect to spend 20.6% of their income on a median-priced rented home while low earners would pay 31.5% of their income for a median-priced rented home in the financial year ending March 2021.
Table 6: Proportion of income of private renting households that is equivalent to rent, West Midlands, financial year ending 2013 to 2021.
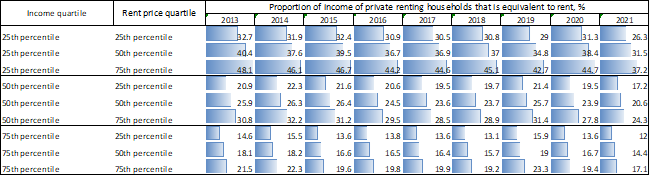
Data source: Private rental market statistics, ONS and Valuation Office Agency, Family Resources Survey – DWWP, NatCen Social Research, ONS, UK Data Service
The lower quartile rent is equivalent to 26.3% of a lower quartile household income while households with median (average) income will pay 17.2% of their income for a similarly priced home, and top earners will only spend 12% of their income. Therefore, richer households who see big increases in their rent may be able to adapt more easily, for example by reducing how much they save or invest each month or changing spending on non-essentials.
In terms of inter-regional comparisons, the West Midlands and East Midlands were the most affordable regions with median rents being equivalent to 21% and 22%, respectively, of median income.
Figure 3: Household type by income decile, 2021/22, UK
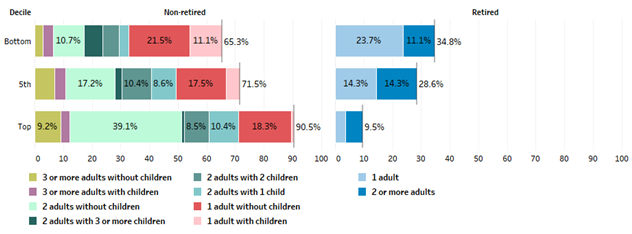
Data source: The effects of Taxes and Benefits on Household Income. Reference Tables, ONS
Data in Figure 3 suggests that a major part of households on low income are those who are non-retired – 65.3% while retired households only make up 34.8%. Furthermore, data suggest that the worst-affected households would be those on low incomes with higher-than-average energy bills, – for example, if they have a large family with dependent children or single-person households with one adult whose incomes would need to be overstretched to cover increased rent and other ongoing spendings at a higher cost.
Figure 4: Employment status of chief economic supporter by decile group, 2021/22, UK
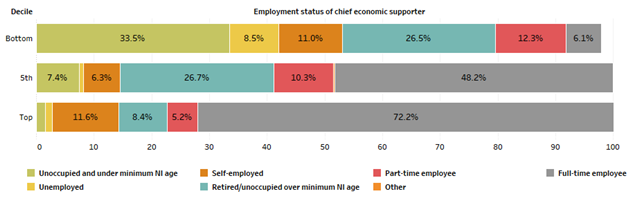
Data source: The effects of Taxes and Benefits on Household Income. Reference Tables, ONS
As shown in Figure 4, unoccupied young people who are under the national insurance age as well as those who are retired may find it especially difficult to pay increased rent for their households as these two groups create 60% of the bottom decile of income distribution, – there are 33.5% of unoccupied and under minimum NI age (which is 16+) and 26.5% retired / unoccupied over minimum NI age (which is 66+).
Summary
Households in the region are clearly being squeezed from each direction as they face rapidly rising prices. Since 2021, energy prices have doubled, food prices are over 25% more expensive, fuel bills have almost doubled, and rent prices are quickly rising. The households most likely to be impacted are those on lower incomes as price rises account for a greater proportion of their earnings. Especially, as the majority of wage rises have been less than half the current inflation rate. However, these prices will not only impact those on lower incomes, middle-income households will also be facing significant price rises, squeezing standards of living.
This blog was written by Alice Pugh, Policy and Data Analyst, Annum Rafique and Maryna Ramcharan, Research Fellows at City-REDI / WMREDI, University of Birmingham.
Disclaimer:
The views expressed in this analysis post are those of the authors and not necessarily those of City-REDI, WMREDI or the University of Birmingham.