 City-REDI have compiled a snapshot of key data for the West Midlands. Drawing on the success of the 2017 databook, the 2018-2019 edition provides up-to-date labour market profiles for the West Midlands Region, West Midlands Combined Authority, three Local Enterprise Partnerships (LEPs) and over 30 Local Authorities. Together, the booklet provides easy to access data on the region’s productivity, population, employment, skills, and housing.
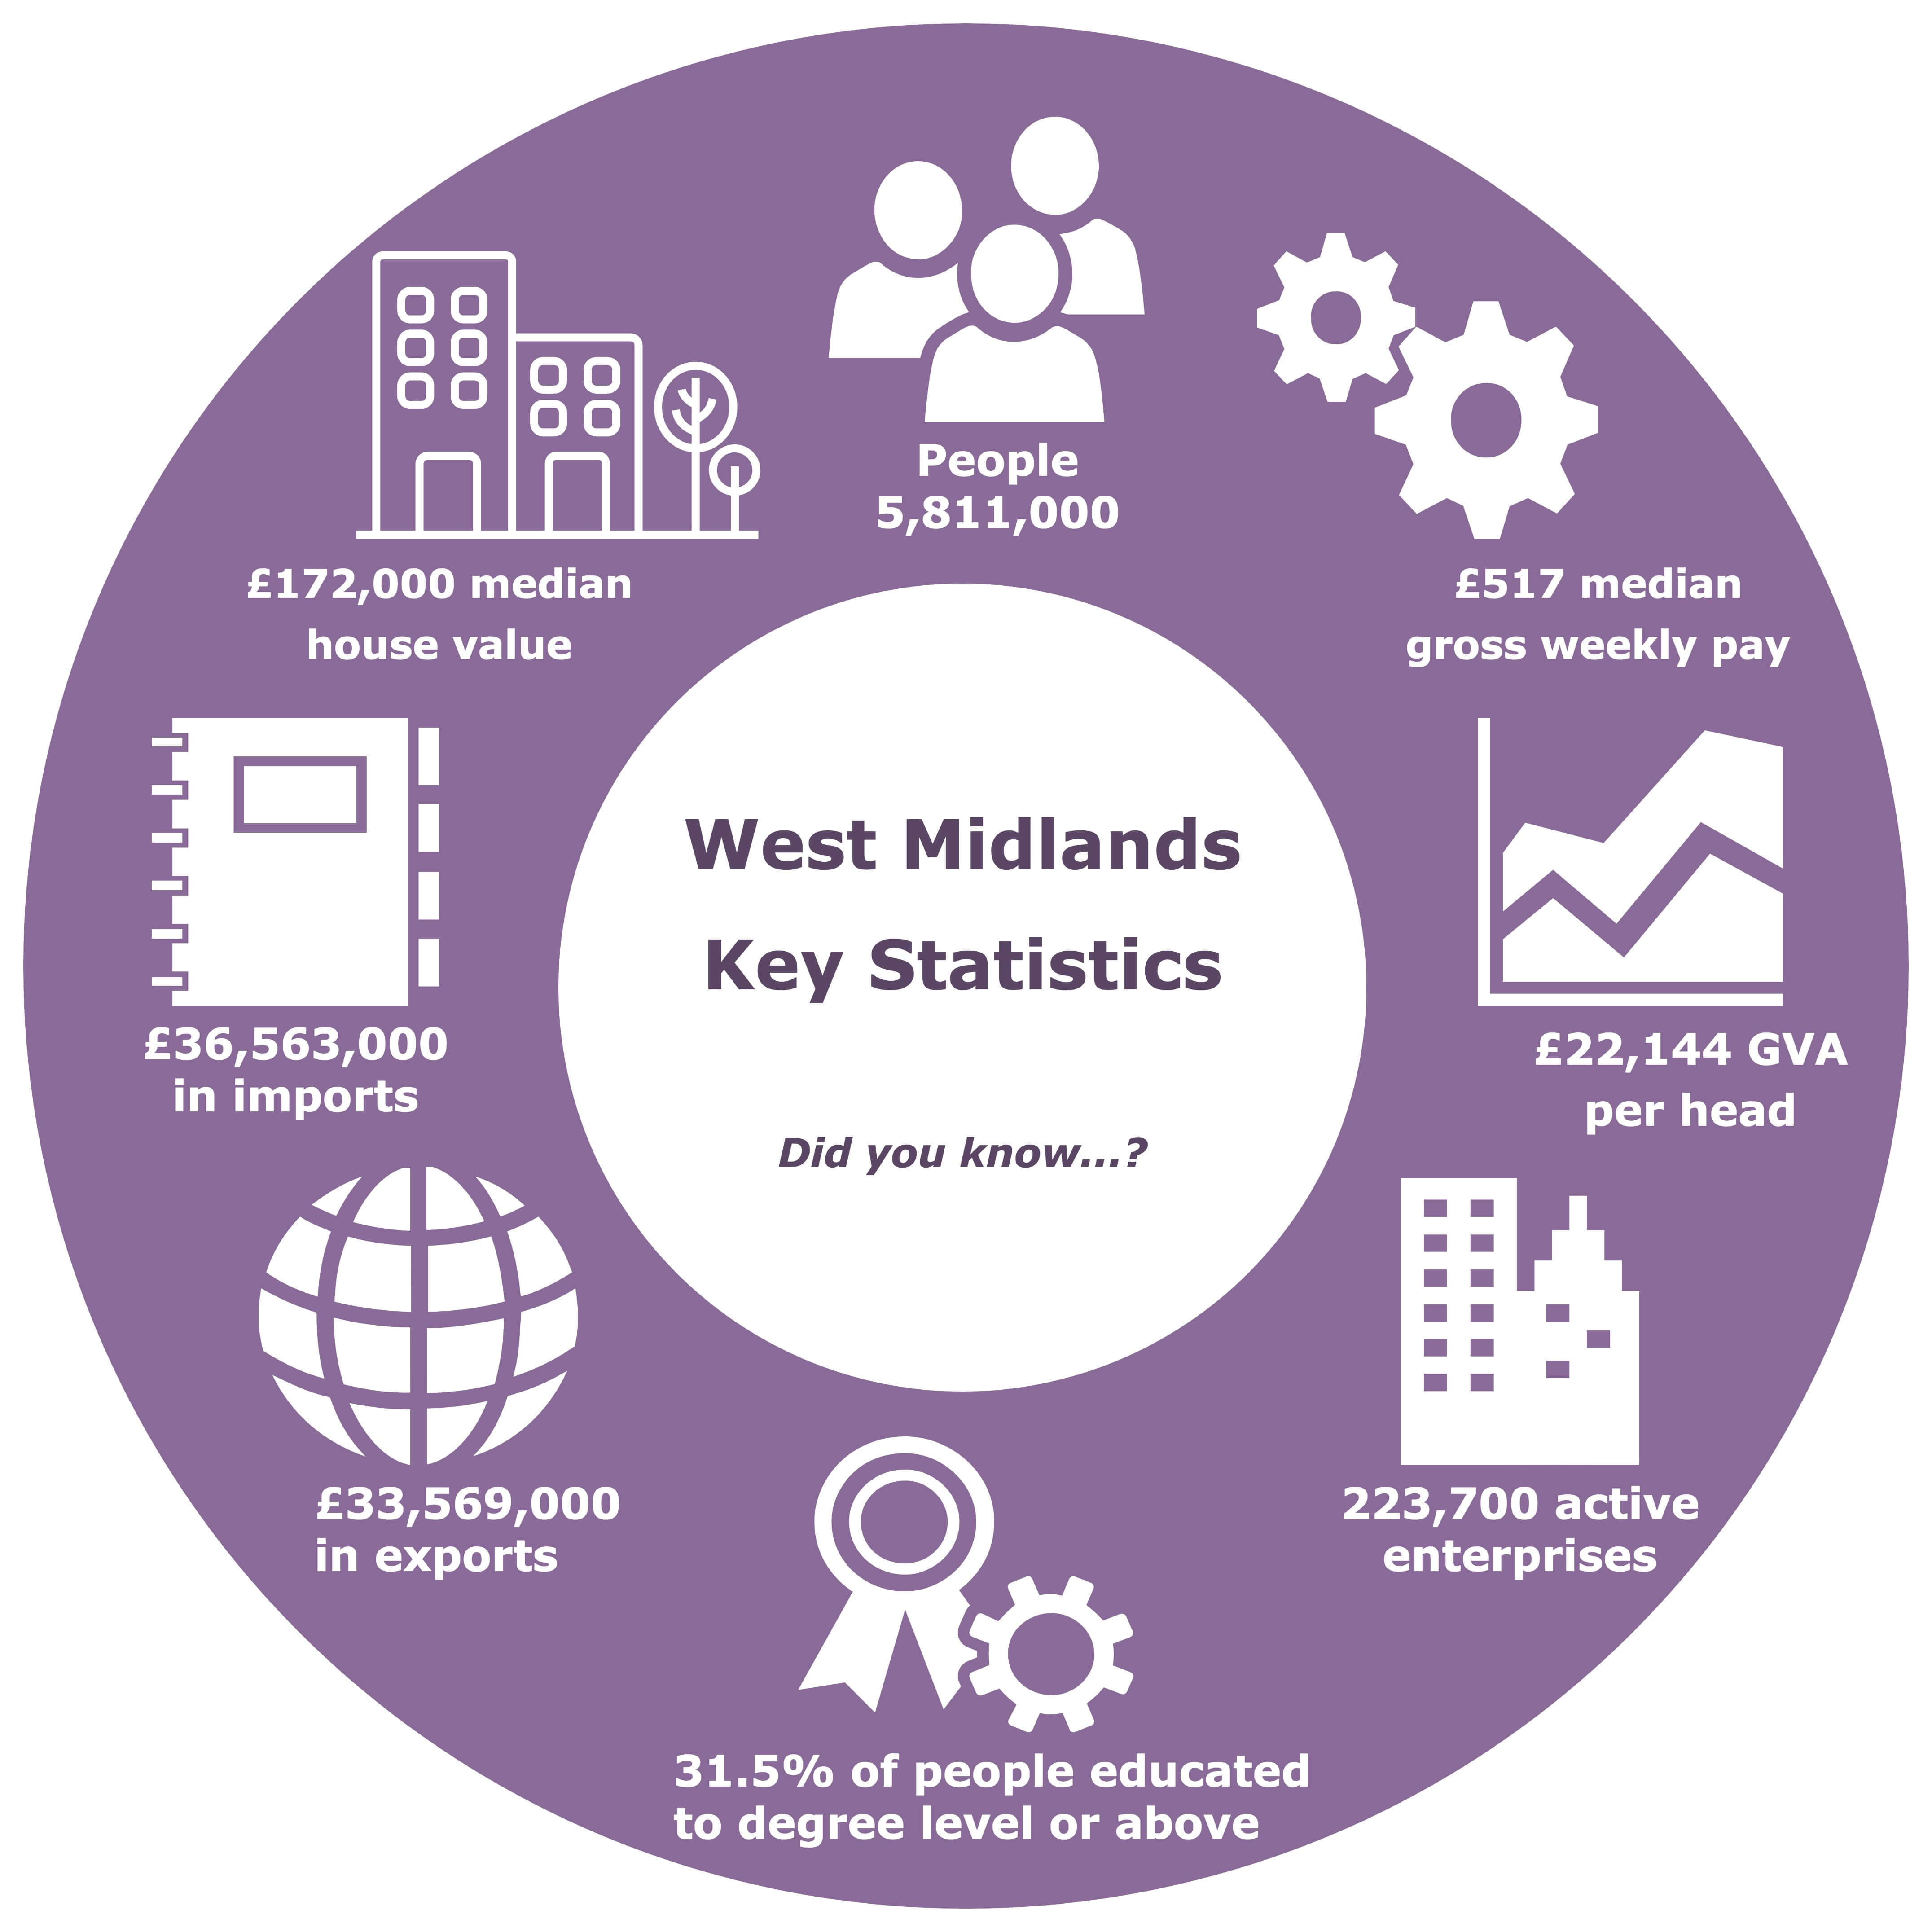
This is a brief commentary on some of the insights that can be gained from the West Midlands Databook:
Things are looking up from last year
GVA is improving
The updated figures identify some positive improvements for the West Midlands region. Gross value added (GVA) per head, a measure of the value of goods and services produced, is up from £20,826 per head to £22,144.
More business enterprises than previous years
It’s good news for business start-ups and survival rates, both of which have improved over the 12-month period. Business enterprises are also ‘on the up’, with over 15,700 additional businesses operating in the West Midlands region over the 12-month period from 2016 to 2017.
A slight fall in unemployment rates
There has been a slight decrease in unemployment rates for the working population (16-64), falling from 5.7% in 2016 to 5.4% for 2017. Yet, youth unemployment remains worryingly high at 24% for 16 to 19 year olds and 12% for 20 to 24 year olds.

How does the West Midlands Combined Authority measure up?
The databook also presents key statistics for the West Midlands Combined Authority (WMCA) and its competitor city-regions. This covers the Greater Manchester Combined Authority (GMCA), Liverpool City Region Combined Authority (LCRCA), London Combined Authority (LON), North East Combined Authority (NECA) and Sheffield City Region Combined Authority (SCRCA).
While things are looking up for the WMCA, certain challenges remain:
The house prices are on the rise
The West Midlands Combined Authority has seen year on year increases in median house prices. These have risen for a further year with a median house price for the region totalling £155,000. This puts the West Midlands Combined Authority second, only behind the London Combined Authority which has a striking median of £450,000.
Employment continues to fall behind comparator regions
Though increasing from an employment rate of 62.8% in 2012 to 67.3% in 2017, the West Midlands Combined Authority continues to be the city-region with the lowest employment rate. The nearest comparator is the Liverpool City Region Combined Authority which has a 70% employment rate. The London Combined Authority again comes out on top, with employment at 74% of the working population.
Skills and education remain an area of concern
The skills deficit remains an ongoing problem. The West Midlands Combined Authority scores lowest among its competitor regions for those of working age (16-64) with qualifications at NVQ level 4 and above. In 2017 these plateaued at 29.6% of working age residents possessing NVQ level 4 and above, in contrast to 51.9% for the London Combined Authority.
Summary
Overall, the stats support City-REDI’s analysis that the labour market in the West Midlands is improving, but it is essential that the momentum continues when pushing for inclusive pathways to economic growth. See our Birmingham Economic Review 2018 for an overview of the strengths and weaknesses of the Birmingham economy.
This blog identifies a snapshot of the data provided in the pocketsize databook for the West Midlands.
To receive a free copy of the West Midlands Databook please click here.
Or to download a copy, please click here.
This blog was written by Laura Reynolds, Data and Policy Analyst, City-REDI, University of Birmingham.
Disclaimer:
The views expressed in this analysis post are those of the authors and not necessarily those of City-REDI or the University of Birmingham.
To sign up for our blog mailing list, please click here.