Donald Houston looks at levels of unemployment in Greater Birmingham and how the region compares with other metropolitan areas in the UK.

This article was written for the Birmingham Economic Review 2023.

The review is produced by City-REDI / WMREDI, the University of Birmingham and the Greater Birmingham Chambers of Commerce. It is an in-depth exploration of the economy of England’s second city and a high-quality resource for informing research, policy and investment decisions.
Why does unemployment matter?
Unemployment serves as a general barometer of economic buoyancy, in normal circumstances tending to fall as business activity rises. More specifically, unemployment is a measure of the level of spare capacity in the labour market – so a certain level of unemployment is required to enable businesses to fill vacancies and grow.
As well as providing these important barometer functions, unemployment in and of itself has damaging effects on businesses, not to mention the individuals who find themselves involuntarily out of work. Although unemployment only affects a relatively small minority of the workforce at any one time, fear of unemployment can dampen consumption beyond those immediately affected.
Long-term unemployment can blight a local area of investment and business confidence, as well as the misery it can bring to the individuals and households affected.
The UK and Greater Birmingham labour markets are still adjusting to the shocks of the pandemic and Brexit. This has produced a slightly unusual situation since late 2022 of simultaneously rising employment and unemployment as both labour demand and supply recover in parallel.
At a time of relatively low national unemployment by historic standards (4.0% in March-May 2023) and labour shortages, intelligence on local labour supply is important. Unemployment in Greater Birmingham fell sharply between 2021 and 2022 before stabilising and then rising slightly in the first half of 2023. Nevertheless, unemployment in Greater Birmingham remains relatively high, at 5.2% of the active workforce in 2022. The count of claimants receiving state benefits for reasons of unemployment in Greater Birmingham is higher still, at 7.9% in 2022. As such, Greater Birmingham may wish to counter the national narrative about labour shortages and low unemployment and retain a focus on bringing unemployment down, while also remaining vigilant on the availability of adequate labour supply moving forward.
How is unemployment measured?
Unemployment is not as straightforward to measure as may be first assumed. Although we think of unemployment as quite clear-cut (i.e., someone is either unemployed or not), there are in reality varying degrees of attachment to the labour market among those not employed. This is why three measures of unemployment are described here (figure below), not least because they are at quite different levels and have not all moved in the same direction at the same time over recent years.
The first is the UK Government’s official measure of unemployment, which follows the UN’s International Labour Office (ILO) definition of unemployment: currently not working; searched for work in the previous four weeks; and available to start work in the next two weeks. This information is collected by the Office for National Statistics (ONS) in the Annual Population Survey (APS) and Labour Force Survey (LFS).
The second measure is the claimant count, which is those claiming benefits for reasons of unemployment. Not all the ILO unemployed are eligible for or claim benefits, and not all on the claimant count meet all the criteria to be ILO unemployed. Until 2020, the claimant count had always been lower than ILO unemployment. Around 2016, the two measures began to converge because of greater job search requirements under the new Universal Credit benefits system. After a large spike in 2020 linked to the Coronavirus pandemic, the claimant count has been greater than ILO unemployment, although the gap has been narrowing again since.
A third measure that may be identified beyond the two measures noted above is the economically inactive who say they want a job. Many members of this group face considerable obstacles to re-entering the workforce relating to age, health, skills or caring responsibilities. These obstacles can discourage people in this category from searching for work regularly and/or make them unavailable to immediately start work.
How high is unemployment in Greater Birmingham?
Depending on which of the above three measures is used, unemployment in Greater Birmingham in 2022 was in the range of some 50-100,000 people (figure below), representing around 5-10% of the economically active population. Alternative estimates of ‘hidden unemployment’ among recipients of incapacity-related benefits put the ‘real’ level of unemployment towards the upper end of this range, for example, 78,000 in the City of Birmingham alone.
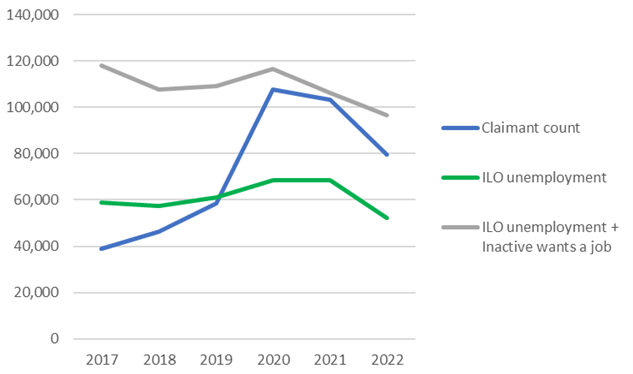
The lowest of the three measures outlined above, ILO unemployment, was 52,200 in Greater Birmingham in 2022 (figure below), representing 5.2% of the economically active population. Claimant unemployment is somewhat higher at 79,375 or 7.9%. Adding the economically inactive who say they want a job to ILO unemployment gives a total of 96,600 people who can be considered involuntarily out of work, representing 9.2% of the active workforce plus the inactive who say they want a job.
Three measures of unemployment in Greater Birmingham, 2017-22
What are the recent trends in unemployment in Greater Birmingham and the UK?
During the Coronavirus pandemic, claimant unemployment rose sharply but ILO unemployment rose only modestly in Greater Birmingham (figure above). This was in part because lockdown meant hiring and job search activities were difficult or impossible – and thus fewer people met the job search requirement in the ILO definition than might otherwise have been the case.
All three measures are considerably lower than at the Coronavirus peak in 2020. There were particularly sharp drops in both claimant and ILO unemployment between 2021 and 2022. Over this one-year period in Greater Birmingham, claimant unemployment fell from 103,085 to 79,375, and ILO unemployment from 68,400 to 52,200.
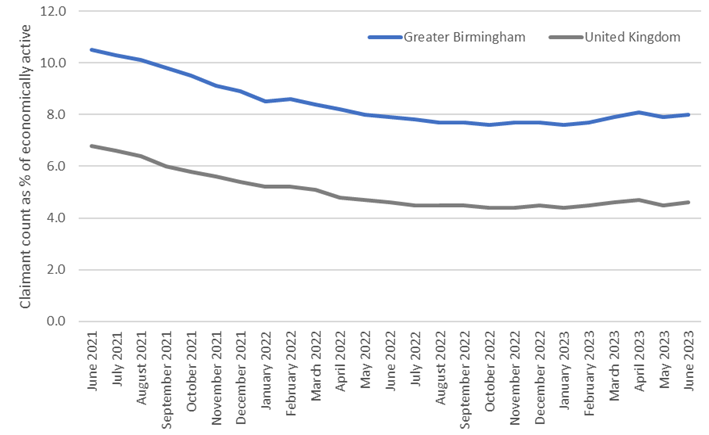
Monthly claimant count data allow us to zoom in on what has happened more recently since 2022. The decline in unemployment since the Coronavirus peak in 2020 levelled off throughout 2022 and then rose slightly in the first half of 2023 (figure below). Greater Birmingham almost exactly mirrors movements in the UK trend over this period, but consistently has claimant unemployment around 3.5 percentage points above national average.
Monthly claimant unemployment rate in Greater Birmingham and UK, June 2021 – June 2023.
How does unemployment in Greater Birmingham compare to other metropolitan areas?
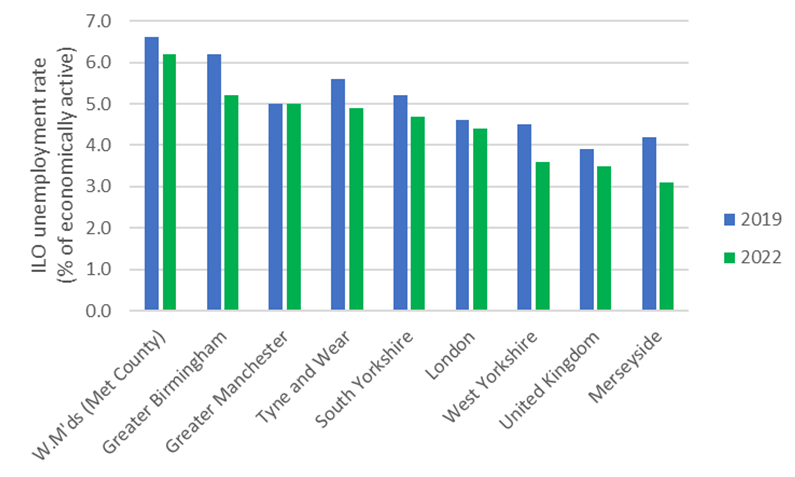
Cities usually have higher unemployment than towns and rural areas. This is due to a variety of factors, including large and competitive urban labour markets; skills and spatial mismatches arising from legacies of economic restructuring; younger and more diverse populations in cities; and higher levels of social deprivation. However, of all English metropolitan areas, the West Midlands Metropolitan County has the highest ILO unemployment rate (figure below). Greater Birmingham also had higher unemployment than any other metropolitan area.
Since pre-pandemic (2019) levels, Greater Birmingham recorded the second largest drop in unemployment (from 6.2% to 5.2%) after Merseyside (which fell from 4.2% to 3.1%). The West Midlands Metropolitan County saw a smaller drop (from 6.6% to 6.2%).
ILO unemployment in metropolitan areas, 2019 and 2022
Conclusions
Unemployment nationally and in Greater Birmingham may be somewhat higher than the Government’s official ILO measure suggests. The official unemployment rate in Greater Birmingham in 2022 stood at 5.2% of the active workforce, compared to 7.9% receiving state benefits for reasons of unemployment. Adding economically inactive people who want a job to the official unemployment figure takes it to 9.2%, although some of this group face considerable obstacles to re-entering employment.
Trends until the middle of 2022 are indicative of a tightening labour market (less labour supply relative to demand) in Greater Birmingham. However, there is still considerable slack in the Greater Birmingham labour market for employers to draw on, at least in terms of the numbers out of work. Worryingly, the post-Covid fall in very high claimant unemployment has stalled since the middle of 2022 and remains above its pre-pandemic level – both in Greater Birmingham and the UK.
There is a powerful national narrative about labour shortages and low unemployment – and for good reason. However, unemployment in Greater Birmingham was higher than the UK average going into the pandemic and has remained so since.
High unemployment in Greater Birmingham is not just a function of being a big city. All other English metropolitan areas have unemployment rates below that in Greater Birmingham. The city and its partners therefore need to keep a focus on bringing unemployment down, while also addressing sector and business-specific recruitment problems.
Read the Birmingham Economic Review in full.
This blog was written by Donald Houston, Professor of Regional Economic Development, City-REDI / WMREDI, University of Birmingham.
Disclaimer:
The views expressed in this analysis post are those of the authors and not necessarily those of City-REDI / WMREDI or the University of Birmingham.