
In the 2023 Spring Statement the UK Government announced plans to expand free childcare to children between 9 months and 2 years old. Matt Lyons and Abi Taylor investigate what this could mean for the West Midlands.
The UK Government announced a £4bn childcare expansion policy in England.
Key objectives of the policy include removing “barriers to work for nearly half a million parents with a child under 3 in England not working due to caring responsibilities, reducing discrimination against women and benefitting the wider economy in the process” by addressing current labour shortages, and potentially, increasing productivity. Currently, government analysis suggests that nearly half a million parents are not working because of caring responsibilities.
The proposal will provide an extra 30 hours a week during term time to parents of children from the age of nine months to two years, matching the existing offering for three- and four-year-olds.
“I don’t want any parents with a child under five to be prevented from working if they want to, because it’s damaging to our economy and unfair mainly to women”
-Jeremy Hunt MP
The childcare reforms will be rolled out in stages. The plan is that:
- From April 2024, all working parents of 2-year-olds will be able to access 15 hours per week of free childcare.
- From September 2024, all working parents of children aged 9 months up to 3 years old will be able to access 15 hours per week of free childcare.
- From September 2025 all working parents of children aged 9 months up to 3 years old can access 30 hours of free childcare per week.

The Office for Budget Responsibility estimated that the extension of free childcare provision of up to 30 hours a week will enable as many as 60,000 mothers to enter the labour force while also improving access to pre-school education. The policy has the potential to have two impacts on the economy:
- The demand shock related to an increase in demand for childcare services from parents
- The labour supply shock as more parents return to work
To get a sense of the scale of impact this policy could have and the potential limitations, we use the SEIM-UK: a multi-regional input-output model developed by City-REDI to estimate a demand shock for the West Midlands.
Skip to the bottom of the blog for a summary of the method.
What is the impact of the increase in demand for childcare?
To apportion the £4 billion government expenditure in childcare policy we apportion across regions based on 2021 Census of Population data showing where children aged 0 to 1 year old are living. London has the largest proportion of children in this age group with the West Midlands having the second-largest share of all English regions (see Table 1). London clearly stands to gain the most. Whilst the West Midlands appears to be the second most important beneficiary, the difference between the West Midlands and other regions is comparatively small. The higher share of children in London and the West Midlands is likely linked to the higher share of young people in these regions. There is also likely an inter-sectional age and ethnicity dimension here with the map also pointing to huge differentiation between urban and rural areas. For example, the map clearly shows how Birmingham, the Black Country, Telford, and Stoke-on-Trent have large proportions aged under 1 year.
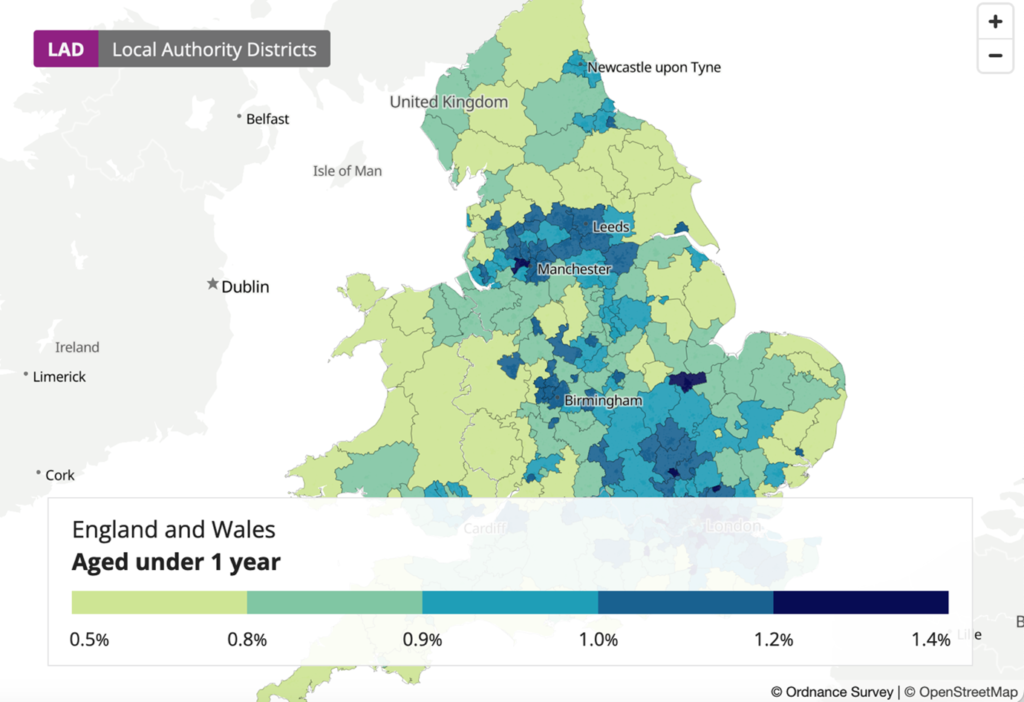
Table 1. The percentage of the population that is aged 0-1 of English NUTS 1 Regions (mid-2021 data)
| Region | Number aged 0-1 | % of population aged 0-1 |
| North East | 24, | 0.94% |
| North West | 76,445 | 1.03% |
| Yorkshire and the Humber | 55,437 | 1.01% |
| East Midlands | 46,900 | 0.96% |
| West Midlands | 62,900 | 1.06% |
| East of England | 64,759 | 1.02% |
| London | 104,839 | 1.19% |
| South East | 92,044 | 0.99% |
| South West | 51,139 | 0.90% |
The West Midlands apportionment of the £4 billion policy is £434 million. If we treat this as a demand shock to the childcare services sector, we can see the impact that this could have on sectors, occupations and households.
Table 2 shows the ten most impacted sectors in terms of employment (full-time equivalent FTE) based on the £434 million shock in the West Midlands. The shock indicates that the most impacted sector is the sectors containing childcare Human health and social work activities. However, it is also clear that sectors throughout the supply chain are likely to be impacted indirectly. While the modelling is conducted in FTE, this will likely disguise the large numbers of part-time workers engaged in sectors that contain childcare.
Table 2. Sectoral impact on employment (FTE) in England due to a demand shock in the West Midlands childcare sector
| Sector | Employment Change (FTE) |
| Human health and social work activities | 9,575 |
| Professional, scientific and technical activities | 800 |
| Wholesale and retail trade; repair of motor vehicles | 150 |
| Financial and insurance activities | 150 |
| Education | 150 |
| Information and communication | 100 |
| Construction | 100 |
| Other service activities | 100 |
| Transportation and storage | 75 |
| Accommodation and food service activities | 50 |
Numbers rounded to the nearest 25, Source: SEIM-UK
Table 3 shows the top 10 most impacted occupations in terms of employment change from the demand shock in the West Midlands. The table reveals that there would likely be a 1.81% increase in the demand for Caring Personal Service Occupations in the region, demanding a further 3,150 FTEs. Other health occupations also see strong increases in demand.
As referenced, in Table 2, the indirect supply-chain relationships also mean that there will be an increase in jobs in other occupations throughout the economy.
Table 3. The impact of a demand shock in the West Midlands childcare sector on occupations in the West Midlands
| Occupation (two-digit SOC) | Total change in jobs (FTE) | % change in jobs (FTE) |
| 22 Health Professionals | 2,650 | 2.29% |
| 61 Caring Personal Service Occupations | 3,150 | 1.81% |
| 32 Health And Social Care Associate Professionals | 600 | 1.49% |
| 42 Secretarial And Related Occupations | 400 | 0.78% |
| 24 Business, Media And Public Service Professionals | 650 | 0.42% |
| 41 Administrative Occupations | 750 | 0.39% |
| 12 Other Managers And Proprietors | 250 | 0.30% |
| 11 Corporate Managers And Directors | 575 | 0.29% |
| 35 Business, Public Service Associate Prof | 525 | 0.29% |
| 62 Leisure, Travel And Related Personal Service | 100 | 0.26% |
Does the West Midlands have enough appropriately skilled workers?
Using an experimental labour market model, we attempt to map whether the increase in demand for occupations can be matched by the current labour pool in the West Midlands. Figure 1 shows the change in demand by 9 aggregated occupation categories versus the available supply*(see limitations at the end of the blog). What can be observed is that despite a relatively large supply in categories such as Professional Occupations and Caring, Leisure and Other Service Occupations, the increases in demand will likely overshoot the supply leading to skills shortages.
Figure 1. Labour Supply and demand matching in the West Midlands
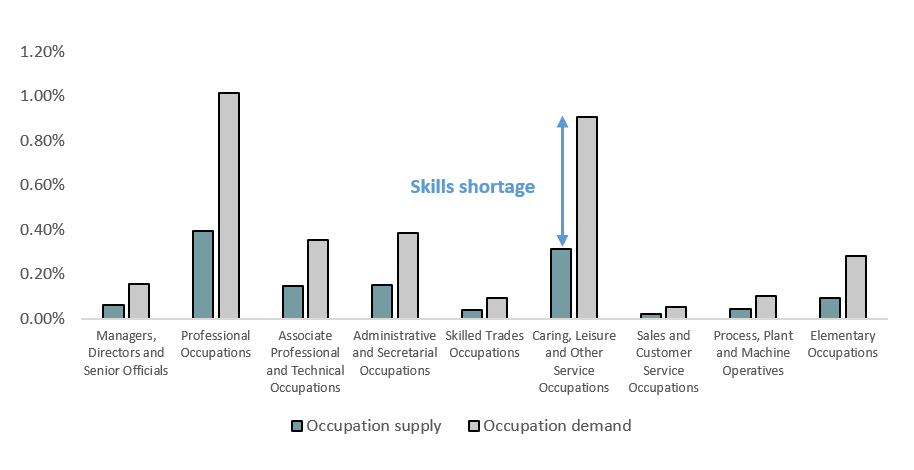
Such shortages likely mean that parents of children aged nine months to two years looking to benefit from the extra 30 hours a week during term time may find that provision is unavailable, at least locally. Shortages in provision could disproportionately impact parents in the most underrepresented areas, where reliance on hyper-local provision is particularly important.
The likelihood of skills shortages raises questions about the extent to which the West Midlands will be able to expand training to support the upskilling of the requisite workforce. Implications exist both in relation to the number of direct childcare staff as well as the number of managers likely to be required if a large number of childcare posts need to be created. Previous research City-REDI researchers for the Industrial Strategy Council emphasised how upskilling managers is essential for managers to fulfil their crucial role in championing and monitoring skills development and utilisation.
Impact on Households
Figure 2 indicates the change in household incomes as a result of the £4 billion shock across all English regions by income quintile. However, there are considerable differences by region. Regions with the greatest number of people aged 0-1 relative to their population see a larger income impact than other regions, which is unsurprising. More surprising is the trend for lower income households to benefit more than higher ones does not hold for all regions notably, the North East.
Furthermore, it is important to note that a percentage increase in incomes for lowest-income households is likely to have a greater impact than on those in higher quintiles, particularly during a cost-of-living crisis.
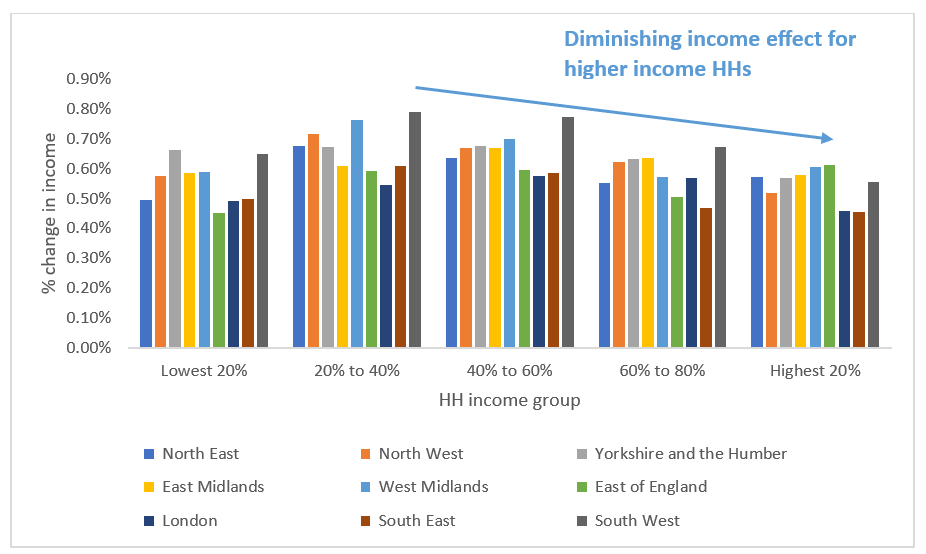
Figure 2. Regional % change in Income (Compensation of labour) simulation results household (HH) quintiles
Concluding remarks
Overall, our analysis suggests that finding sufficient staff with the relevant skills may be a key challenge for the Government’s plan to increase free childcare provision for children aged nine months to two years. It also emphasises that the Government’s planned expansion to childcare policy will likely have a significant impact on regional economies but the impact is likely to vary across regions.
The impacts modelled do not consider the additional impacts of an increased workforce size or the implications for prices and productivity. The model also assumes that all parents will want to take up the additional provision provided. Existing research has indicated how formal childcare use is much higher in less deprived areas of England and varies by ethnicity.
Key questions that the simulation cannot answer include:
- Can the region accommodate an increase in demand for childcare?
- Are there enough skilled workers to fulfil likely increases in demand?
A short summary of the potential opportunities for, and limitations of, the policy is listed here:
| Strengths/Opportunities
+ Increase tax base + Equality benefits ( in work) + Poverty reduction + Early years education improved? |
Weaknesses/Threats
– Likely there is not a sufficient supply of skilled carers to fulfil demand (including wraparound provision in schools) – Are there enough nursery places? – How will the policy be funded? – Will provision be available in the right places for the most disadvantaged parents to take advantage of? – Unclear whether provision will address current childcare challenges for parents working anti-social hours or on zero-hour contracts |
Approaches to address some of the challenges suggested could range from bursaries for individuals to undertake qualifications in childcare to increasing the supply of skilled childcare workers, to relaxing child-to-carer ratios depending on safety considerations. It may be the case that local government will need to plan for new demand possibly by building nurseries that are socially funded. To get a scale of some of these issues, further research is required.
Future research
Methodology refinements: This simulation shows a relatively crude estimation of the impact of the policy. Future research will look to improve the precision of the methodology, consider the temporal dimension of the policy implementation and incorporate the labour supply into the model to provide some detail on absorptive capacity.
Interviews for broader understanding: We also plan to undertake qualitative interviews in the West Midlands with childcare providers and parents of young children who could potentially benefit from the policy. The research will aim to better understand how they consider the policy will play out in practice, in particular, key challenges and opportunities that they anticipate
Training implications: What sort of training is likely to be needed to facilitate the expansion of childcare provision? Which organisations are best suited and have sufficient capacity to offer the training (e.g. colleges, hospitals, universities)? Who will fund the training?
Notes on the method
- UK government announce £4bn childcare expansion policy in England. We treat this as a £4bn shock to the sector in the SEIM UK model that contains childcare (S27: Human health and social work activities)
- To apportion the shock across regions we divide the £4bn across English regions based on the number of 0–1-year-olds in each region (Figure 1)
- In Figure 1 – Occupation supply is determined by vacancies and occupation demand is determined by type-I Leontief in our experimental SEIM-UK model
- The West Midlands refers to the NUTS-1 region definition
Limitations
- The method assumes the shock is in one sector and in one year.
- The approach does not consider the impact of increased labour force participation.
- The employment effect is reported in FTE which is biased by very different hours/employees in the different occupations.
- The SEIM-UK labour market and household modules are experimental and in the early stages of development with results subject to change.
- Local variations are important and are disguised by regional averages.
This blog was written by Dr Matt Lyons and Abigail Taylor, Research Fellows, City-REDI / WMREDI, University of Birmingham.
Disclaimer:
The views expressed in this analysis post are those of the authors and not necessarily those of City-REDI / WM REDI or the University of Birmingham.