
In celebration of International Women’s Day, Maryna Ramcharan discusses how income inequality remains a major challenge in the UK.
Previous research has shown that disparities in income distribution are shaped not only by differences between the richest and poorest households, but also by structural inequalities across groups within the labour market. Gender remains one of the most persistent dimensions of this inequality. Differences in representation across occupations, sectors and leadership roles continue to shape how income and opportunities are distributed within the economy.
One important aspect of gender inequality concerns representation in senior and leadership positions. If women face barriers to reaching higher-paid roles within organisations, this can reinforce broader income inequality. Understanding how these barriers emerge is therefore important for assessing progress towards a more inclusive labour market.
How can we measure the glass ceiling?
To explore gender representation in senior roles, a simple glass ceiling indicator can be constructed using pay quartile data reported by employers. Under the UK Gender Pay Gap reporting requirements, organisations must publish the proportion of men and women in four pay quartiles, ranging from the lowest-paid to the highest-paid employees.
The highest pay quartile typically includes executives, directors, top managers and other high-earning roles, and can therefore be used as a proxy for leadership positions within organisations. The upper-middle quartile often includes senior professionals, managers and experienced specialists, representing an important stage in the leadership pipeline.
The glass ceiling indicator can be calculated as the difference between the average share of women in the overall workforce and the share of women in the upper-middle pay quartile:
A positive value of this indicator suggests that women are under-represented in the leadership pipeline relative to their presence in the workforce, which may signal barriers to progression into senior positions. Conversely, values close to zero indicate that women are represented in senior roles roughly in proportion to their presence in the workforce.
Negative values occur when the share of women in senior roles exceeds their sectoral average representation in the workforce, suggesting relatively strong female representation within leadership structures in the company.
Interpreting the glass ceiling chart. The chart plots two indicators derived from gender pay gap reporting data. The vertical axis shows the share of women in the highest pay quartile within each company, which serves as a proxy for representation in top leadership positions. The horizontal axis shows the glass ceiling indicator, capturing differences between women’s representation in the workforce and their presence in the upper-middle pay quartile.
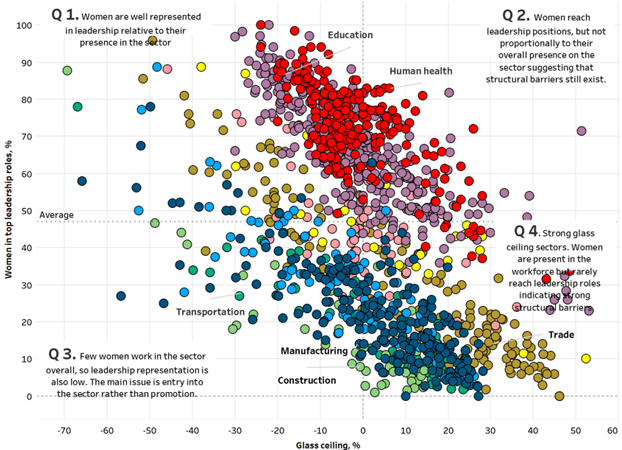
Together, these two indicators provide insight into how gender inequality can emerge at different stages of organisational hierarchies. In some companies the main barrier appears within the leadership pipeline, while in others, women may reach senior positions but remain under-represented in the highest-paid roles.
Four patterns of gender inequality. If we group companies into four categories depending on where they are located in the chart, we can identify different patterns of gender inequality across organisations.
Quadrant 1. Strong leadership representation. Companies located in the upper-left quadrant combine relatively high female representation in the highest pay quartile with a small or negative glass ceiling indicator. In these organisations, women are present in both the leadership pipeline and the top pay quartile in proportions broadly consistent with their overall workforce representation. This suggests that once women enter these sectors, progression into senior roles may be relatively more accessible.
Quadrant 2. Limited pipeline but some leadership presence. Some companies appear in the upper-right quadrant, where the glass ceiling indicator is positive but the share of women in the top pay quartile remains relatively high. This suggests that while women may be under-represented in the broader leadership pipeline, some have nevertheless reached top positions. In such cases the issue may lie more in the development of a wider pipeline of female leaders.
Quadrant 3. Barriers in the leadership pipeline. The lower-right quadrant includes companies where the share of women in the leadership roles is relatively low, and the glass ceiling indicator is strongly positive. In these organisations women appear to face barriers entering senior positions in the upper-middle quartile, which in turn limits their progression into the highest-paid leadership roles. This pattern may indicate structural obstacles within promotion pathways.
Quadrant 4. Pipeline presence but limited access to top roles. Finally, companies located in the lower-left quadrant show relatively small glass ceiling indicators but low representation of women in the highest pay roles. In these organisations women appear to be present in the upper-middle pay quartile but are less likely to progress into the very top positions, indicating a potential barrier at the final step into senior leadership.
Sector patterns. Several broader sectoral patterns also emerge from the chart:
Women-dominated sectors show stronger representation leadership. Female-dominated sectors such as human health and education tend to show higher representation of women in leadership positions relative to their presence in the workforce. These sectors have an average female employment share of around 70–76%, and many organisations show smaller glass ceiling indicators.
Strong glass ceiling in men-dominated sectors. In contrast, male-dominated industries such as manufacturing, construction and transportation tend to show stronger glass ceiling effects. While women are present in these sectors, they are significantly under-represented in the highest pay quartile, indicating barriers to progression into senior roles.
Interestingly, some companies in male-dominated industries show negative glass ceiling indicators, meaning that women are relatively well represented in leadership positions despite their small presence in the overall workforce. In these cases, the main challenge appears to be entry into the sector rather than promotion once employed.
Government departments show a mixed pattern. Government departments show a mixed pattern. While women account for a large share of the workforce (around 64% on average), many departments still show a positive glass ceiling indicator, suggesting that women are concentrated in lower-paid roles. This pattern is particularly visible in areas such as policing and security services.
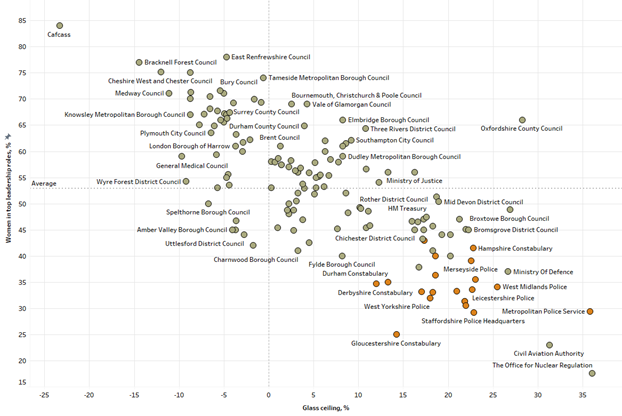
The role of organisational culture. Most sectors, particularly wholesale and retail trade (where women account for around 46% of employment) and real estate (55% of women), show substantial variation across companies. The wide dispersion of firms across the chart suggests that organisational practices and internal promotion structures may play an important role in shaping leadership opportunities.
These patterns highlight that gender outcomes are not determined solely by sector characteristics. Differences in organisational culture, leadership practices and career development pathways can significantly influence progression opportunities for women.
The glass ceiling is not universal. While many companies show clear signs of a glass ceiling, the pattern is not universal. Several organisations appear in the upper-left quadrant of the chart, combining relatively strong female representation in the highest pay quartile with a small or even negative glass ceiling indicator.
In these cases, women appear to be represented in both the leadership pipeline and the highest-paid positions in proportions broadly consistent with their presence in the workforce. Some of these organisations operate in sectors where women remain under-represented overall, suggesting that organisational practices and promotion pathways can play an important role in shaping leadership outcomes.
These examples demonstrate that gender imbalances in leadership are not inevitable and that some companies have been more successful in supporting women’s progression into senior roles.
Understanding where these bottlenecks occur – whether at entry into a sector, within promotion pipelines, or at the transition to top leadership – is essential for designing policies aimed at reducing gender inequality in the labour market.
This blog was written by Maryna Ramcharan, Senior Policy and Data Analyst, City-REDI.
Disclaimer:
The views expressed in this analysis post are those of the author and not necessarily those of City-REDI or the University of Birmingham.