
The City Index Tool is a data dashboard which allows users to compare and rank 61 English cities using a varierty of metrics and categories.

Alice Pugh demonstrates its use by comparing the 8 English members of the Core City UK alliance.

View the City Index, part of the WMREDI Data Lab.
What is the City Index tool?
The City Index tool is a dashboard developed by WMREDI, which uses 50 different metrics to compare city places, using Parliament’s local authority definition of city places, by ranking the English cities across 10 different categories to establish how well cities are performing nationally.
In total there are 61 cities (including London boroughs) identified across the index where the data is available. Each city place has an overall score between 0 and 1 for each metric, with 1 being the best performer and 0 being the worst. Based on how well cities performs against the other cities in the metric, it considers the distribution of how well it performs against others. Metrics are grouped into 1 of 10 categories and the category score of each city is the mean metric score of the group. The categories are:
- Sustainability and Environment
- Society and Wellbeing
- Skills and Labour Markets
- Innovation
- Infrastructure
- Inclusivity
- Health and Education
- Governance and Institutions
- Economic Development
- Business Environment
Finally, the overall score is the total mean of all the metric scores for a city.
What are the 8 core cities?
Core Cities (CC) UK is an alliance of 11 cities – Belfast, Birmingham, Bristol, Cardiff, Glasgow, Leeds, Liverpool, Manchester, Newcastle, Nottingham and Sheffield. It is their mission to unlock the full potential of city regions to create stronger, fairer economies and societies. The 8 core cities are those that are located within England, therefore excluding Belfast, Cardiff and Glasgow.
Overall Ranking
Relative to each other the CC city places perform similarly, with 7 of the 8 having a metric index score of between 0.483 and 0.443 and placing between 44th and 54th place (table 1). However, Bristol noticeably outperforms the rest of the CC areas overall, with a City Index total metric score of 0.516 and places 32nd out of the 61 city place areas.
| Ranking | City | Score |
| 32 | Bristol, City of | 0.516 |
| 44 | Sheffield | 0.483 |
| 46 | Manchester | 0.474 |
| 48 | Leeds | 0.470 |
| 50 | Birmingham | 0.464 |
| 52 | Nottingham | 0.447 |
| 53 | Newcastle upon Tyne | 0.444 |
| 54 | Liverpool | 0.443 |
Source: City REDI- City Index, 2022
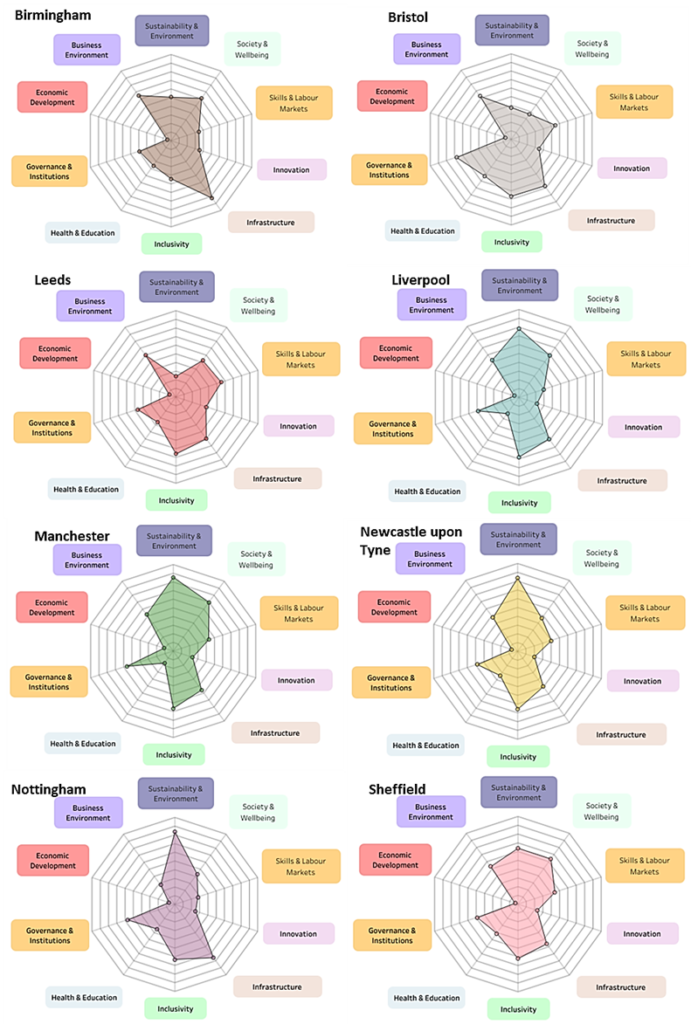
When looking across the metric scores by category, as seen in figure 1, there is little similarity in metric scores across the geographies. Only Manchester and Liverpool appear to share a similar profile across all the categories. Overall, the performance of CC areas against the different categorised metrics varies greatly by place. In only a couple of category metrics do we see similarities across almost all the CC geographies, these being economic development and inclusivity.
Economic Development
One area where all areas score similarly is economic development, where all CC geographies scored poorly. There is only one metric under this category which is Gross Value Added (GVA) per head. Manchester was the highest performing in this metric with an average metric index score of 0.11293 out of 1, with a GVA per head of £41,178, as seen in figure 2. Comparative to this the lowest performing CC geography was Sheffield which had a metric score of 0.03673 out of 1, with a GVA per head of £21,698. This means that Manchester’s GVA per head, as the highest-performing CC area, is almost double that of the lowest-performing geography, Sheffield. Clearly, there are great disparities between the different CC geographies, though Manchester does greatly outperform the other CC geographies.
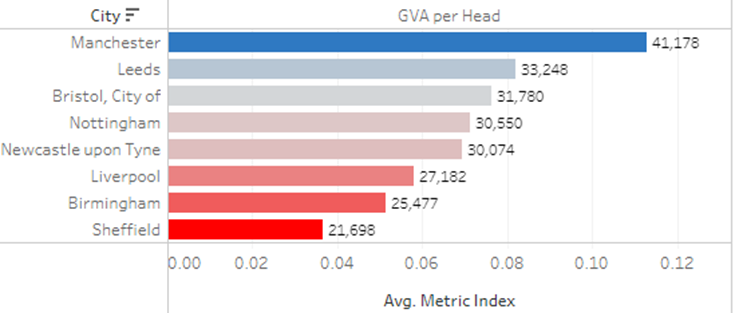
However, whilst Manchester may perform the best amongst the CC geographies, compared to the other city places outside of these geographies, Manchester performs poorly and this is why its metric index score is so low, as seen in figure 1. Westminster is the highest performing in this metric, with a City Index average score metric score of 1, its average GVA per head is £267,958. The GVA per head of Westminster is, therefore, almost 8 times larger than that of Manchester and over twice the size of the second highest performing city place Camden, with a GVA per head of £131,284 and an average metric index score of 0.465. Therefore, all other city places have low metric scores, because compared to Westminster all city places perform poorly. It is Westminster, which is the outlier, significantly outperforming every other city place, even those within close proximity to its own geography.
Inclusivity
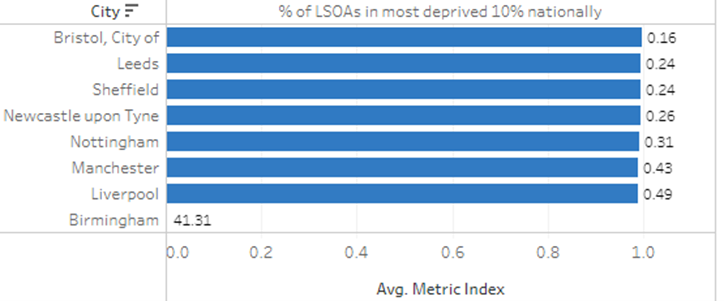
This was another area where the CC geographies had a similar performance, as seen in figure 1. However, Birmingham did not perform as well in this category compared to the other core cities. Whilst Birmingham has a similar level of performance, compared to the other CC geographies, in 2 of the 3 metrics in this category, these being gross disposable household income (GDHI) per head and percentage of jobs under the living wage; it greatly underperforms in the 3rd metric, this being the percentage of Lower Layer Super Output Areas (LSAOs) in the most deprived 10% nationally. As seen in figure 3, whilst most of the CC geographies have less than 1% of its LSAOs in its most deprived 10% nationally, Birmingham had 41% of its LSAOs within the most deprived 10% nationally. Dragging down Birmingham’s overall metric score for this category.
Policy Implications
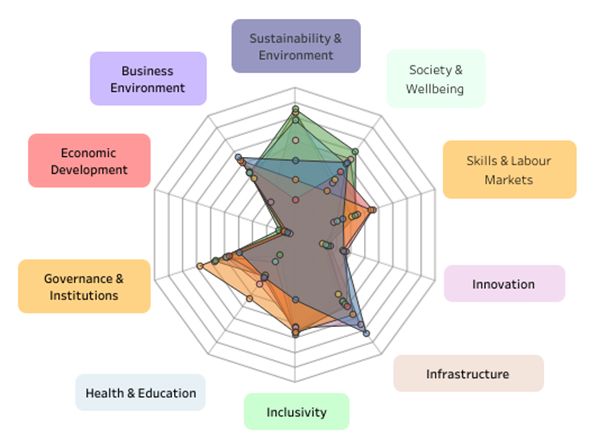
The graph below shows the radar graphs from figure 1 overlapping to show where there is clustering and similarities between the CC geographies. Across the other categories, aside from economic development and inclusivity, there are few similarities in performance by CC place. This shows that each city has its own unique challenges that need tackling. For instance, Liverpool and Birmingham both have low scores in the skills and labour market category, however, the reasoning for these low scores is different. Birmingham has low levels of Not in Education, Employment or Training (NEETs), whereas Liverpool has high levels of NEETs. Liverpool has a higher percentage of NVQ4+ than Birmingham. This would suggest that Liverpool needs more policies and interventions aimed at NEET 16-to-17-year-olds, whereas Birmingham needs to place greater focus on helping its workforce achieve those higher qualification rates, in order to improve their City Index scores and performance relative to other city places. All these cities, therefore, will need different policies and interventions to tackle different performance issues within their region. The likelihood is that institutes and public bodies within the localities will be best placed to tackle these place-based issues, due to greater knowledge of the needs of the local area.
View the City Index, part of the WMREDI Data Lab.
This blog was written by Alice Pugh, Policy and Data Analyst for City REDI and WM REDI.
Disclaimer:
The views expressed in this analysis post are those of the authors and not necessarily those of City-REDI or the University of Birmingham.