
Rebecca Riley takes a look at some of the factors behind the over-50s leaving work and what this means for the UK labour market.

This blog is part of a series looking at the UK Labour Market. See also:
- How do Fertility Rates and Childcare Costs Play out in the UK Labour Market?
- What Are the Current Challenges in the UK Labour Market and How Can They Be Addressed?
- International Migration and the UK Labour Market: Changes and Challenges
I was asked recently if I knew why people over-50s seem to be leaving the labour market in their droves. Off the cuff, I gave a summary of the complex issues creating the current labour market issues.
The UK Labour Market – A Leaky Bucket
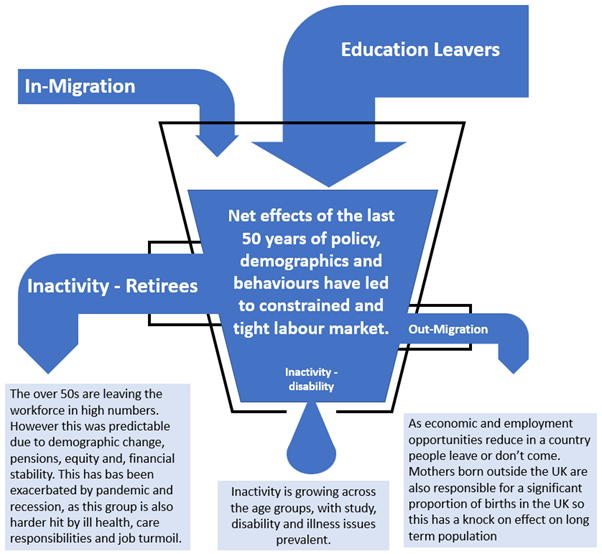
The image above illustrates the complex impacts of policy, demographics, and behaviours on the labour market. It shows the pool of people we have available for work: the ‘bucket’. The population of working age conventionally includes people aged 16-64 – now extended to 65 with the rise in the state pension age. This pool is made up of complex flows in and out which vary in size over time.
Inflows, outflows and the impact of place
The largest inflow is (normally) young people coming out of school, college and university. The largest outflow is retirees. These in and out-flows change the overall volume or depth of the labour market. Fewer young people coming in leads to fewer people filling less experienced roles; more older people going out leads to a deficit in experienced, productive workers, managers, and leaders. As the image above suggests, there are several broad issues impacting the pool of labour. These can be grouped into inflow and outflow issues and vary by place. These will be explored in-depth in future blogs:
Inflows
- Issue – Fertility rates and childcare policies
- Issue – International migration (and emigration)
- Issue – Student behaviour and trends in employment
Outflows
- Issue – Disability and illness, workforce implications
- Issue – Over the 50s and labour market participation
- Issue – Legislation and policy impacts
Place impacts
- Issue – Global Workforce
- Issue – Localised effects in the UK
- Issue – Sustainability and resource constraints
All these issues however are interconnected and do not operate in a vacuum. This makes understanding the actual direct impacts difficult – it is necessary to take each one in turn and review the overall basket and links between the issues.
Births and death – the impact on the labour market
Labour markets are, overall, set decades earlier. As the chart below shows:
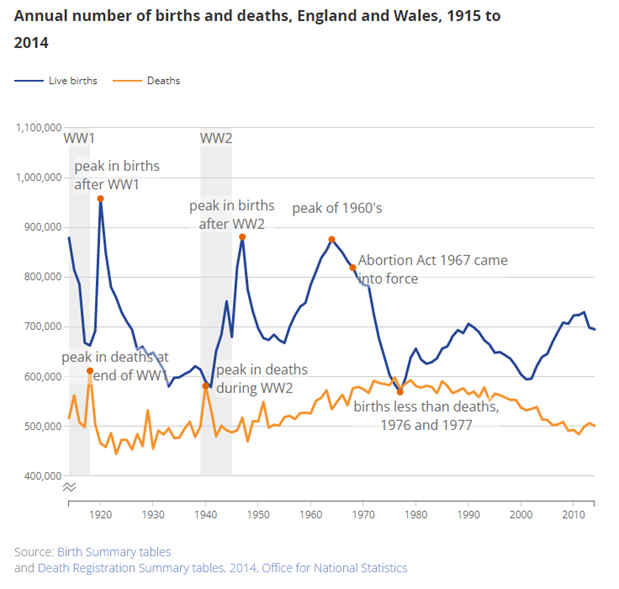
We are all aware of the boomer generation in popular culture. This generation was born between 1946 to 1964; it is bookmarked by two huge birth spikes, 20 years apart, as can be seen above. These generation spikes have moved through the labour market as bulges in available labour. The first of those peaks are now approaching their 80s and in the early 2000s.
According to ONS, in 2000 the average age of exit for men was 63.3 years old, increasing to 65.2 years old in 2020, an increase of 1.9 years. Over the same time, in 2000 the average age of exit for women was 61.2 years old, increasing to 64.3 years old in 2020, an increase of 3.1 years. In fact, 50+ employment rates have increased over time; however, they remain at low percentages for 65 and over.
The working age 50 to 64, the employment rate increased from 55.8% in 1984 to 72% in 2020. For those aged 65 and over, the employment rate increased from 4.9% in 1984 to 10.4% in 2020. A feature of this group was fewer women working than today, so the employment effect of the group ageing was dampened. The older spike age group is now contributing to the health and social care sector demand issues we are seeing. They are the first generation to have been recipients of National Health Service care throughout their lives. This creates a cohort effect of the need for skilled carers to look after this generation and the following spike. The second spike is now in their late 50s and early 60s. This makes them disproportionately large in the labour market, and they are naturally hitting retirement.
The over-50s leaving the workforce
When we see headlines about the number of the over-50s leaving the labour market, it should be recognised that this was always going to happen as it is a normal part of life. Importantly, ONS numbers show that of those leaving the workforce one-third are aged 55 to 59 years, and only 1 in 10 are aged 50 to 54 years. The issue with this cohort is its high volume in the labour market relative to previous cohorts means it has a bigger impact. Also, more women have worked than in previous cohorts, so the overall outflow is also higher. This has been compounded by post-pandemic illness and job fatigue in this cohort who were more likely to suffer from long covid and other delayed health issues.
ONS has stated that of the people surveyed in August 2022, in the 50-54 cohort are more likely than other cohorts to leave due to stress and not feeling supported in their job, they are also more likely to have lost their job. Of all people leaving the labour market 3 in 10 are left to retire and half of this group is in aged between 60 and 65.
The impact of house prices
ONS work on why people are leaving the workforce (Aug 2022) has highlighted the majority (66%) owned their homes outright and have not returned to the labour market.
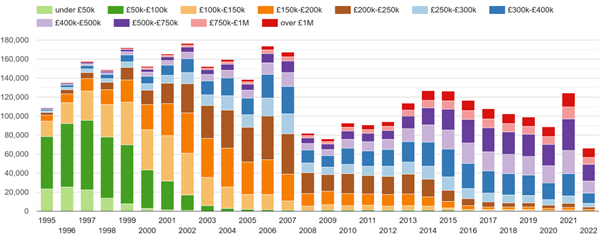
Leavers were more likely to be debt free (61%) compared with those who left their job and returned to work (42% debt free). The second cohort of baby boomers would have been buying their first houses just as the market started growing in, where the average price was £35k, by 2000 prices had doubled to £100k. Since then, they have had 37 years to pay off mortgages, move and re-mortgage. People in the next cohort born in the 1970s would be looking to buy first houses at nearly double the cost of those 10 years older. The average house price is now £265k. Housing equity is also a considerable source of financial resilience and we have seen a shift – for example in the London housing market seen below – of house price boom as the number of sales has increased at the higher price brackets, which is also contributing to the over 50s ability to retire early.
London Property sales volumes – yearly sales volumes by nominal price ranges
Housing costs significantly affect financial resilience, which ONS highlights (Aug 2022) vary by age: those aged 50 to 54 years were significantly less likely to be debt free, excluding a mortgage (49%), compared with those aged 60 to 65 years (62%), and more likely to have credit card debt (39%, compared with 24%). More than half (55%) of those aged 60 to 65 years were confident or very confident that their retirement provisions would meet their needs, compared with just over one-third (38%) of those aged 50 to 54 years. This suggests that the slightly younger group are more likely to return to work. However, adults aged 50 to 59 years were more likely to report mental health reasons (8%) and disability (8%) as a reason for not returning to work.
The impact of pensions
This younger cohort, in their late 50s and early 60s, is also less reliant on state pensions. This means the ability to retire early has become more accessible.
The pensions timeline shows the State Pension was introduced in 1946, the Social Security Pensions Act in 1978 and ran until 2022, this State Earnings Related Pension Scheme (SERPs) scheme enabled employers and employees to pay into a pension, this means the 1946 population bulge have paid into State Pensions all their life, and SERPs from 32 years old. The second population bulge has had SERPs all their working life. Stakeholder Pensions were introduced when this group was in their late 30s, so this still gives them 20-30 years of additional pension growth. This means that the second cohort has seen the best pension terms so far of any generation, and is less likely to be impacted by the closure of defined-benefit pensions. Restrictions brought in from 2006 have restricted pensions for future generations, including the amount that can be put into pension pots, changes to inheritance tax, and state pension ages. However, in 2012 auto-enrolment was introduced, in the future, the generation born after 1992 and retiring beyond 2042 could have favourable pension conditions.
A dramatic drop in birth rates
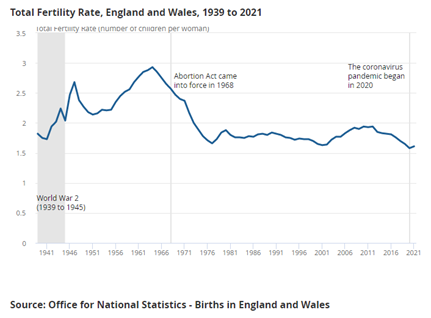
Since the 1960s boom, birth rates have dropped dramatically as can be seen in the chart below. Greater industrialisation, urbanisation, and rising affluence drive this. This is a spillover effect of more women working, being educated, and earning. It has been seen globally that investing in women leads to smaller, healthier families and general economic growth. This means that successive cohorts have led to reduced numbers entering the workforce, this has been compounded recently by the raising of the school leaving age to 18 (since 2015). As the boomer generation exits employment this leaves a hole in the workforce that needs to be filled through other means.
Latest data shows birth rates have decreased even further, according to ONS the number of births decreased in 2020, to 683,191, which was a fall of 29,489 from 2019; this means that natural change in the UK in 2020 was negative 6,438: the first time deaths have exceeded births in 44 years (in part also due to increased covid related deaths). This means both ends of the labour pool are continuing to be squeezed. The introduction of the Abortion Act in 1968 impacted directly the birth rates (see diagram above).
The impact of migration
As the opening diagram shows, the other direct source of inflow into the labour market is international migration. Current government policy has attempted to restrict this, with an expectation since EU Exit that migration flows would reduce.
However, the UK has stayed broadly in line with other high-income countries. There have been increases in temporary workers and students recently, but these are usually short-term and leave after a couple of years. Up to 2016 the largest component in immigration was EU citizens; by June 2022 they did not contribute to net migration at all.
Population projections going forward are increasingly difficult to do, because patterns rely on so many different factors, in both government policy and beyond. For example, the net migration in 2022 was significantly impacted by the Ukrainian war and Hong Kong British National Overseas status holders.
Net migration population projections over the last 20 years have generally undershot the reality, and although they fluctuate, they generally remain relatively stable despite warnings of reduction. These numbers however do not replace the numbers leaving the workforce. Reduced in-migration has a double hit, not only in terms of immediate workers but longer term in relation to fertility rates; in 2014 non-UK mothers accounted for 27%, rising from 19.5% in 2004, of all births in England and Wales, so longer term the births will reduce if immigration reduces.
What does this all mean for the current labour market?
The labour pool will continue to reduce significantly as the next birth peak after 1960 was not until 1990; this means there are 30 years of reduced population. This peak was also half the previous peaks, and the next peak was in 2010, so it will be another 10 years until those young people enter the labour market. and improvement of participation rates, businesses will continue to find it difficult to fill posts. As the 1970s trough is now moving into senior and middle management this also reduces the pool of experienced people who will lead responses to this labour constraint.
All these impacts would suggest that it will be very difficult to get the retiree cohort back into the labour market; they are unlikely to need to return and they have worked and saved into pensions to enable this. The UK government is reportedly looking at tax incentives to get people to return to work, by making the first year back tax free, and also a shake-up of disability benefits. However, the greatest incentive could be the cost-of-living crisis which could outstrip their pension provision, but the time this really takes hold it
For the next 10 years, it is likely that we will see a natural decline in the labour pool as the reduced birth rate cohorts move into the workforce. However, this will probably lead to an overall stabilisation in the labour pool but at a much lower level than seen in previous years.
This points to challenges for the policy as the labour constraints continue for many decades. Opportunities and responses to labour market issues may need to focus on the UK birth rate in the long run, in the short-term migrant labour or technology solutions may become more acute.
In terms of the economy, population growth, particularly of the working-age population, is essential to economic growth, unless the jobs can be replaced by technology. Many countries are seeing similar issues, with China, and a record 98 countries (most of Europe, Japan and Canada) below the replacement rate. Globally population growth is uneven, and although western countries are seeing population decline other countries are still in transition as health, economic and education opportunities are improved. The challenge for international policy is how much the growth constraints in some countries are tackled through the redistribution of the working-age population moving from other countries. How much will countries having a skilled, growing, working-age population become a national asset leading to a competitive edge?
This blog was written by Rebecca Riley, Associate Professor, City-REDI/WMREDI, University of Birmingham.
Disclaimer:
The views expressed in this analysis post are those of the authors and not necessarily those of City-REDI or the University of Birmingham.