
Gantavya Maheshwari reflects on his internship for City-REDI, collecting and analysing data for the Birmingham Economic Review.
The Birmingham Economic Review (BER) is produced annually by the University of Birmingham’s City-REDI and the Greater Birmingham Chambers of Commerce.
The report is an in-depth exploration of the economy of England’s second-largest city and a high-quality resource for informing research policy and investment decisions.
The 2022 Review focuses on the economy of Greater Birmingham as it emerges from the COVID-19 Pandemic and into an ever-changing landscape marred by high inflation and uncertainty. The BER assesses the impact of Brexit, the COVID-19 Pandemic and the cost-of-living crises on businesses, people, and places within the region.

Gross Value Added (GVA)
A key metric analyzed is Gross Value Added (GVA) which we compare across the city-regions that represent England’s core cities and the national average. Greater Birmingham is defined as being the Greater Birmingham and Solihull Local Enterprise Partnership (GBS LEP) region which comprises nine Local Authorities within its boundary. Other city-regions are represented by their respective LEP geographies for consistency.
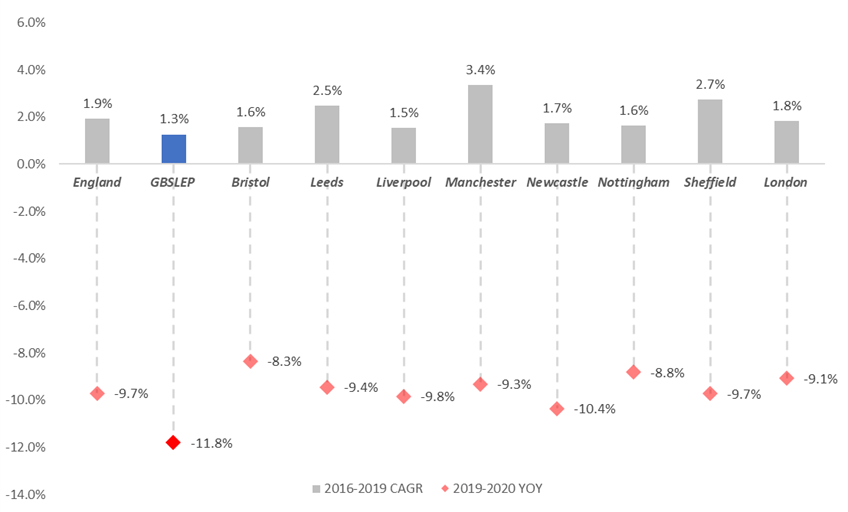
We compare the Compounded Annual Growth Rate (CAGR) from the years of 2016 to 2019 (pre-pandemic) and compare it with the 2019-2020 CAGR. We use GVA as an alternative to the Gross Domestic Product (GDP) as it was available at the LEP level, and it is considered a core metric as it gives the value of an industry’s outputs less the value of intermediate inputs used in the production process.
We can conclude that Greater Birmingham had a slower growth rate pre-pandemic and suffered the most in terms of decline between 2019 and 2020 during the pandemic.
Collecting and Analysing Data
Throughout the process of collecting and analyzing the data for the BER, it was quite interesting to explore a variety of datasets produced by different government organizations such as The Office for National Statistics, HM Revenue & Customs and private companies like Adzuna. Finding the correct data was a challenge at times given that irregular statistical geography exists across different datasets. As an international student, it felt a little tough at the beginning but with constant guidance and support from the team I have become well versed at least in the West Midlands geography.

The way the data is collected in the United Kingdom is also remarkably interesting with divisions going from Local Authorities (lowest level) to each country within the United Kingdom. Sometimes datasets are available at the desired geographic level whereas other times they are not
Due to the COVID-19 Pandemic, there are breaks in the data available from government sources. Because of this, it limited the analysis that could be performed or insight that could be gained and is subject to future revision. Although the most recent datasets were used, they suffer from considerable time lag in certain instances, meaning that the analysis is often out of date. This is a challenge in the current post-pandemic, highly uncertain and ever-changing political and economic situation.

My Experience
As an international student, working for the first time on a project like this, it was quite an enriching experience. I understood the various places from where the data can be sourced for different metrics. It also helped me understand the core metrics one can use to analyze the overall state of an economy across different perspectives. It was quite interesting to look at how the data collection method, authenticity and reliability of data and sources change from country to country.
During my time working on the BER, I also learnt how complex data can be graphically presented with ease so that anyone can understand it at a single glance and how to select between different variables to generate a very comprehensive and in-depth analysis of a region.
This blog was written by Gantavya Maheshwari, Summer Intern, at City-REDI, University of Birmingham.
Disclaimer:
The views expressed in this analysis post are those of the authors and not necessarily those of City-REDI / WM REDI or the University of Birmingham.