
Darja Reuschke explores the geographical trends of homeworking, noting how it is geographically, occupationally and demographically uneven, and reinforces rather than reduces existing patterns of employment inequalities.
The number of workers who mainly work at home in the UK has increased by 5.5 million between 2019-2023. This is almost entirely down to employees taking up this new type of flexible working on a large scale (as opposed to the self-employed of whom a large proportion already mainly worked at home before the pandemic). Amongst employees, the proportion of those who mainly work at home was 3% before the pandemic (660,000 employees) compared to 22% in 2023 (5.9 million employees).
In this blog, I examine working-at-home employees with an emphasis on geography, employee characteristics, industries and occupations in what appears in fact to be a game changer in workplace locations. Throughout, I use the Quarterly Labour Force Survey by the Office for National Statistics (ONS) for the quarters of April to June 2023 and compare it to the same quarter in 2019.
Geography of homeworking
Homeworking employees are concentrated in London and the South East of England. This relative concentration in London is a new trend. Table 1 shows the regional distribution of homeworking employees and of the residential employee workforce. The % point difference between these first two columns shows the over- or under-representation of homeworking employees for each region. For comparison, the over- or under-representation is also shown for 2019. The last column shows the numerical increase in the number of homeworkers between 2019 and 2023 by region.
Pre-COVID, employees who mainly worked at home were concentrated in the East of England and the South East of England, most likely capturing many employees working for firms based in London. Now we see many more employees who work at home and live in Greater London. The overall spike in homeworking employees has in relative terms also spatially shifted away from the South West which is likely to reflect that homeworking has become more of a ‘normal’ work lifestyle (amongst professionals), less associated with the preference for rural living and has risen most for those commuting shorter distances to the employer’s premises.
The concentration of homeworking employees in Greater London can be explained by the spatial concentration of industry sectors in which homeworking is more likely. Once we take the regional imbalance of industry locations into consideration, London has in fact fewer homeworkers than we would expect. The statistical procedure is shown in the Technical Appendix 1. The South East of England, in contrast, has an over-representation of homeworking employees even if we consider the spatial concentrations of industries as well as occupations.
Table 1. Homeworking employees and employee workforce in UK regions
| Government Office Region | % of UK home-workers, 2023 | % of UK workforce, 2023 | % point difference, 2023 | % point difference, 2019 | Increase in home-workers 2019-23 (‘000) |
| North East | 2.7 | 3.9 | -1.2 | -2.1 | 151 |
| North West | 11 | 10.9 | 0.1 | -1.2 | 590 |
| Yorkshire and Humbers | 7.6 | 8.2 | -0.6 | 1.1 | 394 |
| East Midlands | 5.5 | 7.8 | -2.3 | -1 | 287 |
| West Midlands | 7.7 | 9 | -1.3 | -2.3 | 415 |
| East of England | 9.4 | 9.4 | 0 | 1.9 | 483 |
| London | 17.6 | 12.9 | 4.7 | -0.4 | 957 |
| South East | 17.1 | 13.1 | 4 | 5 | 891 |
| South West | 7.5 | 8.2 | -0.7 | 5.4 | 355 |
| Wales | 4.1 | 4.6 | -0.5 | -2.7 | 230 |
| Scotland | 8.2 | 8.5 | -0.3 | -3.1 | 452 |
| Northern Ireland | 1.5 | 3.2 | -1.7 | -0.7 | 73 |
Note: ONS Quarterly Labour Force Survey April – June 2023 & April – June 2019. Column percentages in Column 1 & 2 adding up to 100% (values are rounded), e.g. 2.7% of homeworking employees in the UK live in the North East of England (Column 1) and 3.9% of all UK employees live in this region (Column 2). The % point difference between these columns (Column 3) indicates the concentration or under-representation of homeworking employees relative to the stock of employees.

Who is mainly working at home?
Employees mainly working at home, now have a much younger age profile than pre-COVID (although in comparison with employees who do not mainly work at home, homeworkers are still on average older). Figure 1 shows that the two-hump-shaped age profile of homeworkers before COVID has become less pronounced with the greatest increase of homeworking among employees in their thirties and forties. This corresponds with the highest home working rates amongst those with two dependent children, both men and women, shown in Table 2. In general, however, the link between having children and homeworking has become somewhat less pronounced for women.
Table 3 shows homeworking rates by occupational groups and the relative distribution of homeworkers across these occupation groups as well as the distribution of employee jobs across occupational groups for 2023. Homeworking is strongly associated with high-skilled, professional occupations that comprise just above half of all employee jobs in the UK. The pandemic has reinforced this occupational concentration of working at home in the workforce. Employees who mainly work at home are now more likely to be in the top three – professional – occupational groups than before the pandemic. In numeric terms, 4.7 million employees who mainly worked at home in 2023 (out of 5.9 million employee homeworkers in total) were either managers, professionals or associate professionals. For 29% of the UK workforce, homeworking has remained negligible (skilled trade, caring leisure, low-skilled manufacturing and elementary occupations combined).
Figure 1. The age structure of home workers
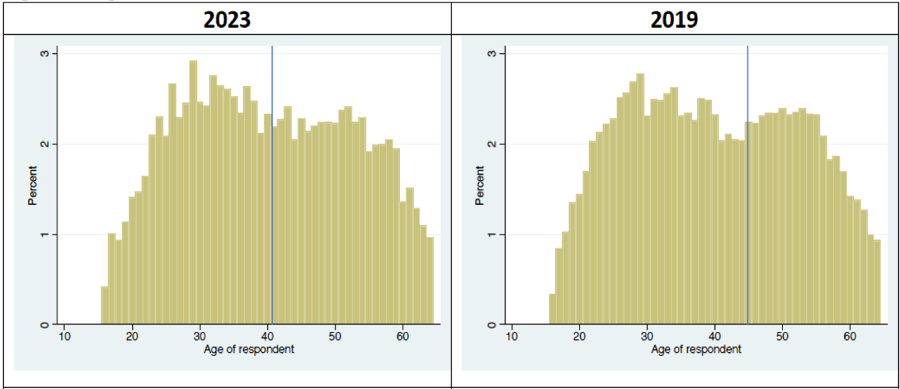
Source: ONS Quarterly Labour Force Survey April – June 2023 & April – June 2019. The blue lines represent the means.
Table 2. Percentage of employees working at home
| Characteristics | 2023 | 2019 |
| Male | 22.3% | 2.4% |
| Male, no dependent child | 21.9% | 2.4% |
| Male, 1 dependent child | 21.4% | 2.7% |
| Male, 2 dependent children | 25.5% | 2.3% |
| Male, 3+ dependent children | 20.7% | 1.9% |
| Female | 21% | 2.5% |
| Female, no dependent child | 21.1% | 2.2% |
| Female, 1 dependent child | 20% | 2.6% |
| Female, 2 dependent children | 23.5% | 3.4% |
| Female, 3+ dependent children | 14.5% | 4.1% |
Note: ONS Quarterly Labour Force Survey April – June 2023 & April-June 2019 depicting homeworking rates. For example, in 2023, 22.3% of male employees mainly worked at home.
Table 3. Employees mainly working at home by occupational groups
| Occupational group |
2023 |
2019 |
|||
| % WFH* within group | % of total number of WFH | % of total number of employees | % WFH within group | % of total number of WFH | |
| Managers, directors | 30.2% | 14.1% | 10.2% | 5.8% | 24% |
| Professionals | 32.3% | 42.7% | 28.7% | 3% | 27.2% |
| Associate professionals | 31.7% | 22.2% | 15.1% | 3.4% | 20.2% |
| Administrative, secretarial | 31.8% | 15.4% | 10.5% | 3.9% | 17.1% |
| Skilled trades | 3.5% | 1% | 6.5% | 0.6% | 1.7% |
| Caring, leisure, other | 1.8% | 0.7% | 8.1% | 1% | 3.6% |
| Sales and customer | 10.2% | 3% | 6.4% | 0.8% | 2.6% |
| Process, plant, machinery | 1.1% | 0.2% | 4.5% | 0.3% | 0.6% |
| Elementary | 1.2% | 0.6% | 10.1% | 0.5% | 2% |
Note: ONS Quarterly Labour Force Survey April – June 2023 & April – June 2019. Values are rounded.
*WFH – working from home amongst employees.
The industry sector variations of homeworking have been documented during the pandemic. However, we need to take a closer look at how this translates to working-at-home patterns for certain social groups. I will look here at mainly working at home by industry sector and by sex to illustrate the issue (Table 4). As the ONS found previously, information and communication businesses are most likely to adopt homeworking. This is a male-dominated industry. The sex differences in the prevalence of homeworking in this industry are small – but from all female homeworkers, only 9% work in this sector compared to 22% of male homeworkers. There are furthermore striking sex differences in industry sectors that have overall low homeworking rates. For instance, women are much more likely to work at home than men in manufacturing, construction and transport. In education, in contrast, the homeworking rate amongst men is double the one of women.
I tested further whether these sex differences occur because women work in different occupations in these industries than men. This analysis is shown in the Technical Appendix 2. This is indeed the case in the transport sector and, to a lesser extent, in manufacturing. In transport, men most likely tend to work in driving jobs that cannot be done at home while women are perhaps more likely to work in administrative and professional jobs that can be done online and therefore are mainly or exclusively at home. However, in construction and education, the sex differences cannot be explained by occupational segregation.
Table 4. Homeworking by industry sector and sex, 2023
| Industry sector (Standard Industry Code in bracket) |
Male employees | Female employees | ||
| % WFH* within industry | % men WFH | % WFH within industry | % women WFH | |
| Agriculture (A) | 14.4% | 0.4% | 13.1% | 0.2% |
| Manufacturing (BCDE) | 12.3% | 8.2% | 25.9% | 6.4% |
| Construction (F) | 11.8% | 3.9% | 31.5% | 3.2% |
| Wholesale (G) | 8.5% | 4.5% | 7.7% | 3.8% |
| Transport (H) | 6.2% | 1.9% | 19.6% | 2.3% |
| Accommodation (I) | 1.3% | 0.3% | 3% | 0.9% |
| Information & Communication (J) | 63.5% | 21.9% | 60% | 8.9% |
| Finance & Real Estate (KL) | 47.3% | 14.6% | 46.4% | 13.1% |
| Professional services (M) | 40.6% | 16.3% | 41.8% | 16% |
| Admin. & public services (NO) | 29.8% | 17.6% | 36.2% | 23% |
| Education (P) | 14.7% | 3.8% | 7.9% | 6% |
| Health & Social work (Q) | 11.7% | 3.8% | 11% | 11.6% |
| Arts and other personal services (RSTU) | 14.9% | 2.9% | 19.7% | 4.5% |
Note: ONS Quarterly Labour Force Survey April-June 2023. Values are rounded.
*WFH – working from home amongst employees.
Conclusions
Looking at the geography of homeworking, it seems then that the homeworking revolution of recent years has not turned around the spatial economy of the UK but rather reinforced pre-existing regional workforce imbalances. The homeworking revolution has also exacerbated pre-existing occupational differences in who has the opportunity to work at home. So far, the level of homeworking has dramatically changed, but its patterns and inequalities by and large have remained the same as before the pandemic.
Despite the spatial imbalances, the number of homeworkers has substantially increased in all regions (Table 1, right column). The data used here does not allow more to be said about the frequency of homeworking but does capture what is now often referred to as ‘hybrid’ working. Figures for mobile working where people go to various places from their home but rarely work at their home, have remained almost unchanged post-COVID compared to before the pandemic. When looking at other data sources (which have not been used here as they do not allow representative conclusions for the UK workforce), the proportion of employees who exclusively work at home is likely to be very small. Hence, most of those recorded here as ‘mainly working at home’ will work sometimes at their employer’s premises.
Homeworking depends to a large extent on the occupation and industry employees work in. Considering the region where people live or demographic characteristics, improves the prediction of homeworking only marginally (see Technical Appendix). Looking at the spatial distribution of the residential population by occupation and industry (e.g. from Census data) will then help us predict the new ‘hybrid’ working patterns at sub-regional levels.
This blog was written by Dr Darja Reuschke, Associate Professor of Regional Economic Development, City-REDI / WMREDI, University of Birmingham.
Disclaimer:
The views expressed in this analysis post are those of the authors and not necessarily those of City-REDI / WMREDI or the University of Birmingham.