
Annum Rafique looks at how much energy we are using in the city region, where it comes from and what kind of houses we live in.
This article was written for the Birmingham Economic Review.
The review is produced by City-REDI / WMREDI, the University of Birmingham and the Greater Birmingham Chambers of Commerce. It is an in-depth exploration of the economy of England’s second city and a high-quality resource for informing research, policy and investment decisions.
Birmingham, being a large metropolitan centre with a population of 1.14 million people living in 423,460 residential homes spread throughout 10 parliamentary constituencies, has a notable variance in energy use.
This variation is caused by a variety of factors, including building energy efficiency, the use of renewable energy generation, the tenure of the houses (whether owned, rented, or social housing), and the predominant property types (detached, semi-detached, terraced houses, flats, and so on). Understanding these elements is critical for understanding the complexities of energy consumption patterns in Birmingham’s different neighbourhoods and providing critical insights for developing sustainable energy practices in the city.
Average Energy Consumption
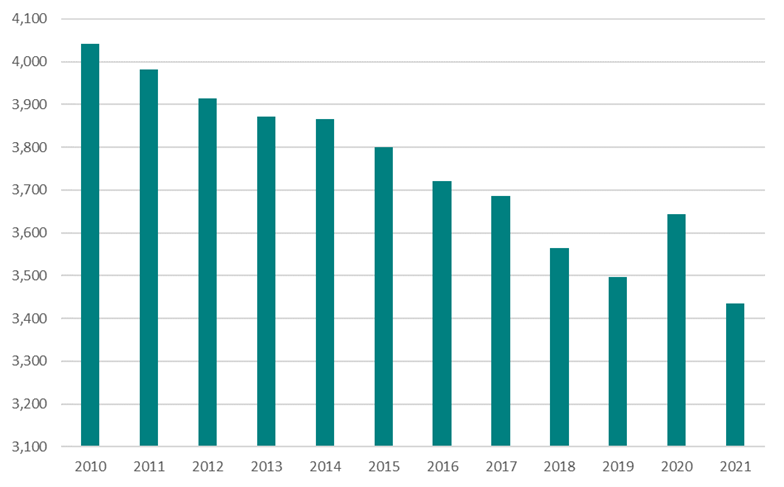
Over time, the average energy consumption per metre (kWh) has decreased by 15% from 4,041kWh/meter in 2010 to 3,435kWh/meter in 2021, possibly due to increased energy efficiency and a shift in consumer behaviour. Although there is a general decreasing tendency, there are times when the levels are quite stable and fluctuate. For example, between 2013 and 2014, consumption remained relatively stable. Similarly, there is a slight increase in consumption from 2019 to 2020 before it decreases again in 2021. The rate of decline in mean electricity consumption per meter appears to be steeper in the earlier years (2010-2014) compared to the later years (2014-2021). This suggests that initial efforts or factors driving energy conservation may have impacted more significantly during that period.
Moreover, in the last few years (2019-2021), there have been fluctuations in the mean electricity consumption per meter. After a steady decrease, there was a slight increase in 2020 due to the COVID-19 restriction. Overall, the trend indicates a decreasing mean electricity consumption per meter, which could be attributed to increased energy conservation awareness, improved energy efficiency, adopting renewable energy sources, and changes in consumer behaviour.
Birmingham’s Electricity Consumption- kWh per meter (2010-2021)
Solar Energy Generation
Solar PV installation has increased over the years due to the introduction of the Feed-in Tariff (FIT) in 2010 to promote the uptake of renewable and low-carbon electricity generation. Between 2010 and 2019, the number of solar PV installations rose 7%. Approximately 97% of all solar PV installations from 2010 to 2019 were for systems under 4kW.
Solar PV installation numbers and capacity (2010-2019)
| Solar PV installation numbers | Solar PV installation capacity | ||||
| Year | PV <=4kW | PV 4-10kW | PV >10–<=100kW | Individual year (kWh) | Cumulative (kWh) |
| 2010 | 111 | 3 | 1 | 260 | 268 |
| 2011 | 1,114 | 11 | 13 | 3,031 | 3,308 |
| 2012 | 1,279 | 10 | 9 | 3,350 | 6,658 |
| 2013 | 1,166 | 10 | 13 | 3,648 | 10,306 |
| 2014 | 811 | 8 | 4 | 2,988 | 13,294 |
| 2015 | 1,164 | 11 | 10 | 4,380 | 17,678 |
| 2016 | 174 | 11 | 4 | 700 | 18,375 |
| 2017 | 124 | 11 | 1 | 456 | 18,831 |
| 2018 | 102 | 18 | 4 | 476 | 19,307 |
| 2019 | 61 | 21 | 3 | 273 | 19,580 |
Source: Ofgem, Feed-in Tariff Installation Report, 2023
Heating type – Birmingham (2021)
Like the rest of the UK, natural gas is Birmingham’s most common heating fuel. In Birmingham, over 74% of all homes heat with mains gas, while 12% do so with electricity. 8% of households utilise two or more fuel types to heat their homes. Around 3% of heating sources are alternative fuel types such as oil, marketed fuel, renewable energy, and others; 2% of households don’t have central heating, and the district or communal heat networks supply 1%.
Heating Fuel Type (2021)
Source: ONS, Central heating, (2023)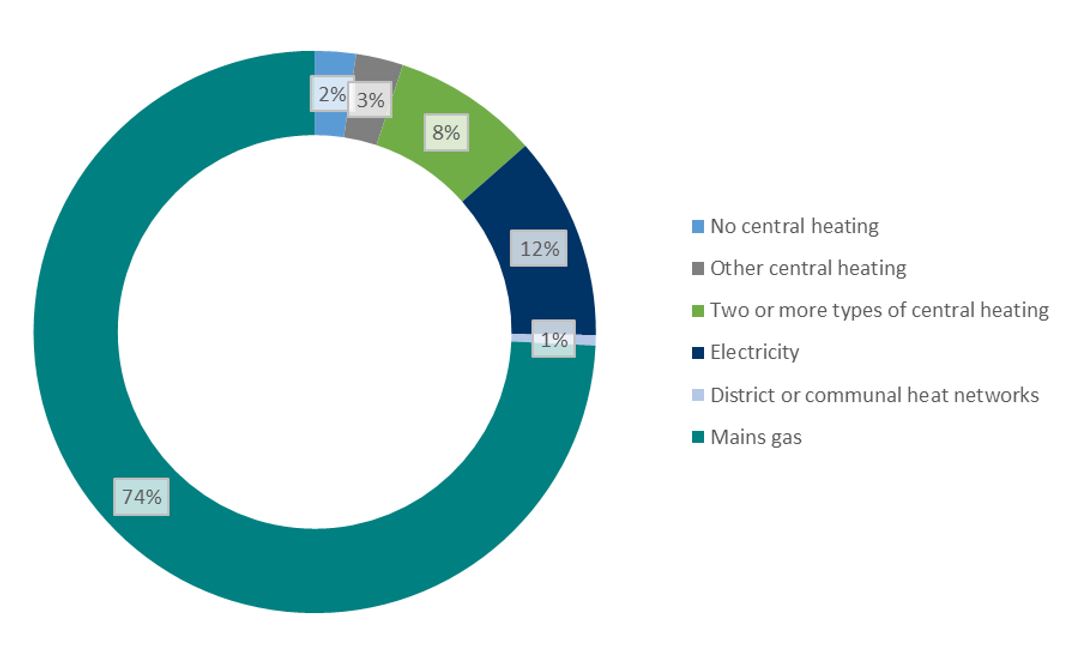
Energy Consumption of Parliamentary Constituencies in Birmingham
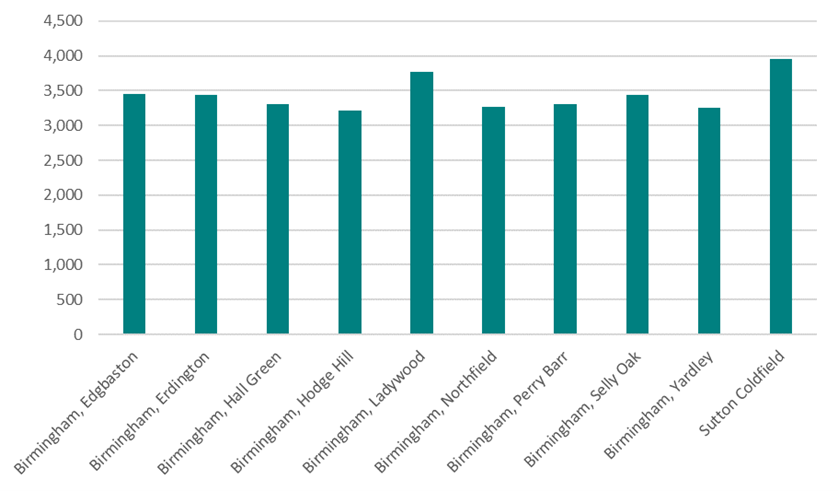
Energy consumption varies significantly across different parliamentary constituencies in Birmingham. Sutton Coldfield has the highest average energy consumption, recording 3,952kWh/meter. Hodge Hill, on the other hand, has the lowest average usage, with 3,222kWh/meter.
Around half of Birmingham’s parliamentary constituencies (Edgbaston, Erdington, Ladywood, Selly Oak, and Sutton Coldfield) had greater average energy consumption per metre than the city-wide average of 3,435kWh/meter. Meanwhile, the other half of Birmingham’s constituencies (Hall Green, Hodge Hill, Northfield, Perry Barr, and Yardley) had lower energy usage per metre than the city. This data demonstrates the variety of energy use trends seen around the city.
Electricity Consumption in Parliamentary Constituencies in Birmingham – kWh per meter (2021)
Median Energy Efficiency (2021)
The Energy Performance Certificate (EPC) provides median energy efficiency scores, which evaluate the energy efficiency of buildings based on various factors such as building materials, heating systems, and insulation. The energy efficiency scores range from 21 to 100, with 100 being the most energy-efficient building. These scores are also associated with specific energy efficiency rating bands: a score greater than 91 corresponds to Band A, 81 to 91 to Band B, 69 to 80 to Band C, 55 to 68 to Band D, 39 to 54 to Band E, and 21 to 38 refers to Band F.
Energy efficiency scores in Birmingham are below 69 in all parliamentary constituencies, suggesting that most households in the city fall within the efficiency rating of Band D. However, there is potential for improvement as all constituencies have the opportunity to move towards Band B. Efforts must be undertaken to improve energy efficiency and boost the overall rating of Birmingham’s buildings.
Median Energy Efficiency Scores in Parliamentary Constituencies in Birmingham (2021)
| Current | Potential | Difference | |
| Birmingham, Edgbaston | 64 | 81 | 17 |
| Birmingham, Erdington | 62 | 82 | 20 |
| Birmingham, Hall Green | 61 | 81 | 19 |
| Birmingham, Hodge Hill | 62 | 82 | 20 |
| Birmingham, Ladywood | 68 | 81 | 12 |
| Birmingham, Northfield | 66 | 83 | 17 |
| Birmingham, Perry Barr | 61 | 82 | 21 |
| Birmingham, Selly Oak | 62 | 82 | 19 |
| Birmingham, Yardley | 62 | 82 | 21 |
| Sutton Coldfield | 65 | 81 | 17 |
Source: ONS, Current and potential energy efficiency of housing, England and Wales, (2023)
Renewable Energy Generation
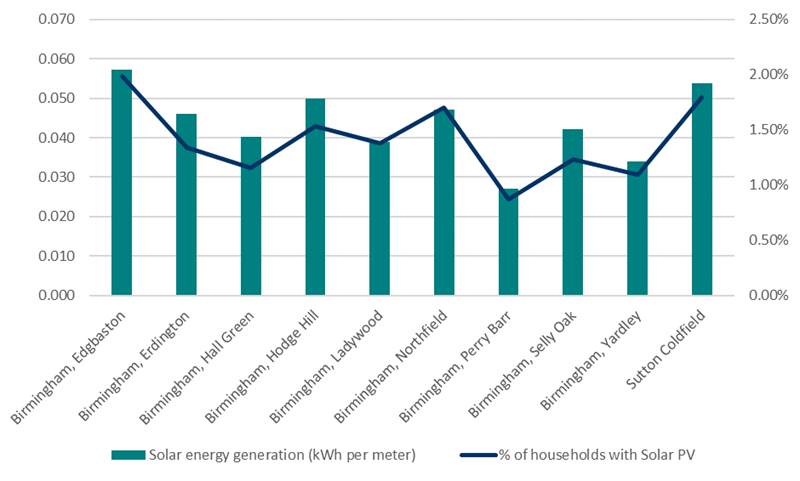
The solar energy generation values range from 0.027 kWh/meter in Perry Barr to 0.057 kWh/meter in Edgbaston. This indicates that there is variation in the amount of solar energy generated across different areas. Parliamentary constituencies like Edgbaston and Sutton Coldfield have higher solar energy generation and a relatively higher percentage of households with solar PV. This suggests that these areas might be more proactive in embracing solar energy technologies or have better conditions for solar installations.
The overall low percentage of houses with solar PV installations suggests that there are barriers to solar energy adoption, such as initial costs, a lack of knowledge, or regulatory obstacles. Addressing these issues might help the region adopt renewable energy more widely.
Solar Energy Generation in Parliamentary Constituencies in Birmingham (2021)
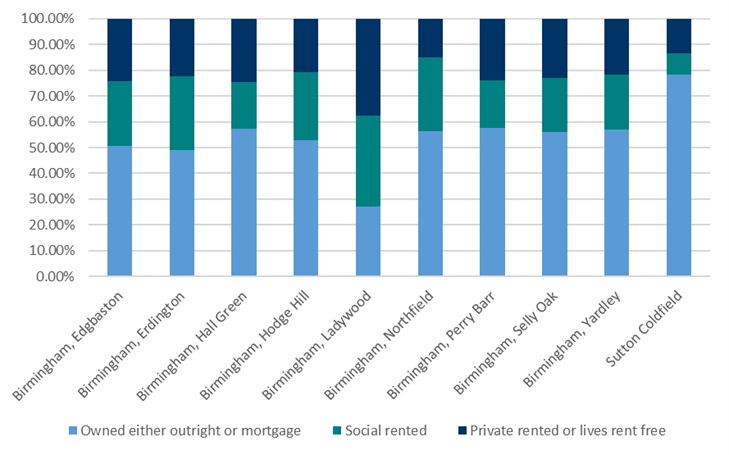
Tenure (2021)
The housing tenure in Birmingham demonstrates a notable level of uniformity, with over 50% of households being occupied by their owners, except for Ladywood, which exhibits the lowest percentage of owner-occupied houses at 27%. In contrast to the other parliamentary constituencies in Birmingham, Ladywood stands out with the highest proportions of rental properties (38%) and social housing (35%).
On the other hand, Sutton Coldfield showcases the lowest percentage of social housing at 8.5% and rented properties at 13%, setting it apart from the rest of the constituencies regarding housing tenure patterns.
Tenure Type in Parliamentary Constituencies in Birmingham (2021)
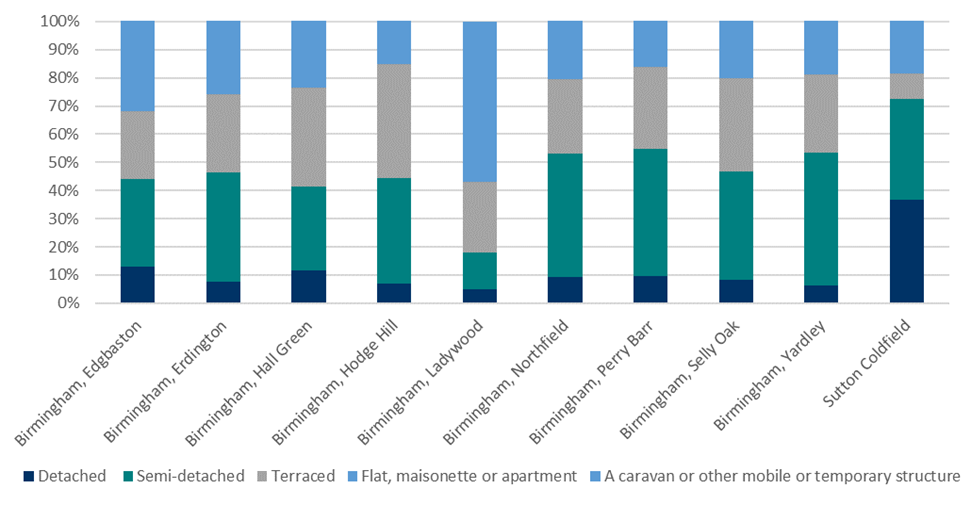
Property Type (2021)
Semi-detached and terraced houses are the predominant type of housing in different constituencies in Birmingham. Ladywood and Sutton Coldfield are outliers, with Sutton Coldfield having the higher percentage of detached housing in Birmingham (37%) and Ladywood having the higher percentage of flats at 57%, mostly due to having a higher percentage of social housing.
In Sutton Coldfield, detached housing comprises a higher percentage (37%) of the overall housing stock, distinguishing it from other areas in Birmingham, where semi-detached and terraced houses are more common. On the other hand, Ladywood stands out due to its higher percentage of flats at 57%, which is primarily attributed to a larger proportion of social housing units in the form of flats.
Property Type in Parliamentary Constituencies in Birmingham (2021)
Read the Birmingham Economic Review in full.
This blog was written by Annum Rafique, Research Fellow City-REDI / WMREDI, University of Birmingham.
Disclaimer:
The views expressed in this analysis post are those of the authors and not necessarily those of City-REDI / WMREDI or the University of Birmingham.