In the latest article from the Birmingham Economic Review, Magda Cepeda Zorrilla discusses how the Index of Multiple Deprivation shows that more than 60% of Birmingham’s population lives in the lowest levels of deprivation.
This article was written for the Birmingham Economic Review.
The review is produced by City-REDI / WMREDI, the University of Birmingham and the Greater Birmingham Chambers of Commerce. It is an in-depth exploration of the economy of England’s second city and a high-quality resource for informing research, policy and investment decisions.
What is the the index of multiple deprivation (IMD)?
The index of multiple deprivation (IMD) is an overall measure of multiple deprivation experienced by people living in an area. It is the official measure of relative deprivation in England and is calculated for every Lower Super Output Area (LSOA) or neighbourhood, in England. The latest available IMD is for 2019.
The IMD provides a set of relative measures of deprivation based on seven different domains of deprivation which cover a wide range of aspects of an individual’s living condition. The Index of Multiple Deprivation (IMD) ranks every small area in England from 1 (most deprived area) to 32,844 (least deprived area).
The IMD combines information from the seven domains to produce an overall relative measure of deprivation. The domains are combined using the following weights:
- Income Deprivation (22.5%)
- Employment Deprivation (22.5%)
- Education, Skills and Training Deprivation (13.5%)
- Health Deprivation and Disability (13.5%)
- Crime (9.3%)
- Barriers to Housing and Services (9.3%)
- Living Environment Deprivation (9.3%)
Here we show data analysed using deprivation ‘deciles’. Deciles are calculated by ranking the 32,844 neighbourhoods in England from most to least deprived and dividing them into 10 equal groups. These range from the most deprived 10% of neighbourhoods nationally to the least deprived 10% of neighbourhoods nationally, as shown in the table below:
Description of the Deciles and Ranks
| Decile | Decile description | Ranks |
| 1 | 10% most deprived | 1 to 3,284 |
| 2 | 10% to 20% | 3,285 to 6,568 |
| 3 | 20% to 30% | 6,569 to 9,853 |
| 4 | 30% to 40% | 9,854 to 13,137 |
| 5 | 40% to 50% | 13,138 to 16,422 |
| 6 | 50% to 60% | 16,423 to 19,706 |
| 7 | 60% to 70% | 19,707 to 22,990 |
| 8 | 70% to 80% | 22,991 to 26,275 |
| 9 | 80% to 90% | 26,276 to 29,559 |
| 10 | 10% least deprived | 29,560 to 32,844 |
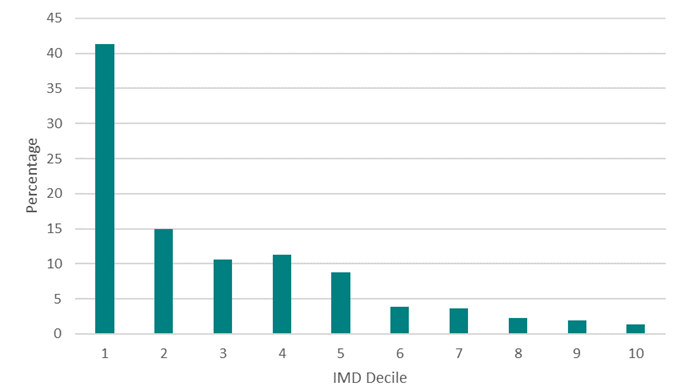
In Birmingham, the data from the IMD shows that more than 60% of the population live in the decile groups 1 to 3, with 41% living in the most deprived decile group (Figure 2)
IMD deciles distribution at the LSOA level
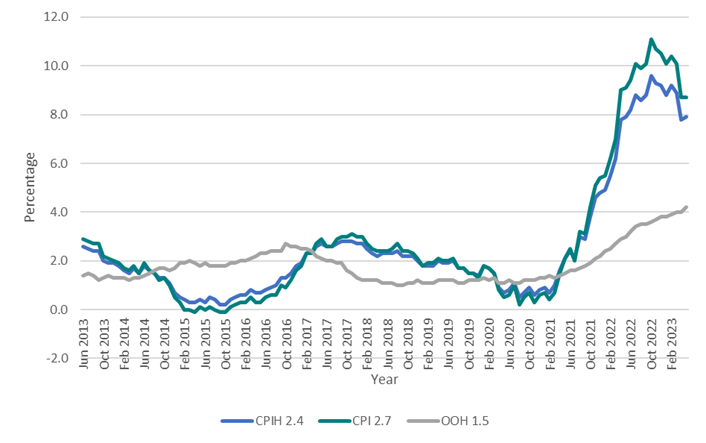
Analysis has concluded that Birmingham suffers from high levels of deprivation; it is ranked as the 7th most deprived local authority in England, and this has not changed since 2015. However, back in 2015, the inflation rate was not as high as now (Figure 3). This is why, now more than ever, it is highly important to provide support for people in the most deprived deciles.
The Consumer Prices Index including Owner Occupiers’Housing Costs, Owner Occupiers’ Housing costs component and Consumer Price Index annual inflation rates for the last 10 years, UK, 2013 to 2023
The Impact of inflation on the deprived sections of society
The impact of inflation and the general cost of living rise will be more keenly felt in deprived segments of society. There are several reasons for this. For example, we might expect the people in this segment to be more likely to live in poorly insulated housing, thus requiring higher use of gas/electricity to heat up their houses.
The limited financial resources of this segment make them highly vulnerable to other aspects of inflationary pressures. Rising prices for food, housing, utilities, and transportation disproportionately affect their ability to afford basic necessities. Consequently, many individuals are forced to make difficult choices, such as cutting back on essential expenses or sacrificing other vital needs, further exacerbating their already precarious living conditions.
Furthermore, this segment is more likely to rent their homes and as the Bank of England raises interest rates landlords are left with little option but to pass on the rate rise to their tenants. The stickiness of the core inflation along with an 18.4% increase in the food prices with no material rise in wages will lead to challenging times for people in the deprived segment.
In conclusion, it is expected that the population in Birmingham living in the most deprived LSOA areas will suffer particularly due to their financial limitations and inflation. These individuals and families are already buying less food, but when wintertime comes, they will face stark choices regarding whether to pay for gas and electricity or buy first necessity products.
Read the full Birmingham Economic Review.
This blog was written by Dr Magda Cepeda Zorrilla, Research Fellow, City-REDI / WMREDI, University of Birmingham.
Disclaimer:
The views expressed in this analysis post are those of the authors and not necessarily those of City-REDI, WMREDI or the University of Birmingham.