 On April 6th 2020 the Institute for Fiscal Studies published a briefing note about which workers are most exposed to the COVID-19 lockdown. In this blog, Tasos Kitsos looks at the relevant figures for a range of sub-national areas focussing on West Midlands Combined Authority and constituent LEPs and Local Authorities.
The sectors directly affected by the lockdown are:
- Non-food, non-pharmaceutical retail (4719, 4730-4772, 4776-4799);
- Passenger transport (4910, 4931-4939, 5010, 5030, 5110)
- Accommodation and food (5510- 5630)
- Travel (7911-7990); childcare (8510, 8891)
- Arts and Leisure (9001-9329 except ‘artistic creation’ 9003)
- Personal care (9601-9609 except ‘funeral and related activities’ 9603)
- Domestic services (9700).
The IFS briefing suggests that, overall, younger aged workers, low earners and females will be the most affected. I use a range of datasets to understand what these figures mean for the West Midlands Combined Authority and constituent areas. The rest of the combined authorities are added to the tables for comparison.
Table 1 shows the size of employment in the sectors directly affected by the COVID-19 lockdown. Nearly 190,000 jobs (14.8%) are in the affected sectors with the highest relative proportion in Solihull and Wolverhampton where 16.3% and 16.1% of the employment is in industries directly affected by the lockdown. These figures are below the national average of 18.2% of employment affected by the lockdown. The reason for this is the focus on hospitality and associated services and the exclusion of manufacturing where the West Midlands has high shares of employment.
Part-time working will be hit harder by the lockdown with almost 25% of part-time employment in WMCA being in the lockdown sectors compared to 10.1% of full-time employment. This is because the sectors affected (e.g. hospitality) are industries with a high prevalence of part-time working conditions. Again, compared to the national average, the WMCA has lower employment shares in the industries directly affected.
The WMCA has a high proportion of under 25s, and in particular females, and this may be a cause for concern since the IFS briefing suggests that younger aged workers and females are over-represented in the affected sectors. Publicly available data do not allow us to measure the size of female and younger aged workers in the affected industries so our best guess is based on the relative size of these populations.
Going beyond the IFS briefing and looking at the number of businesses, approximately a fifth of businesses in WMCA are directly affected by the COVID-19 lockdown. This is equivalent to the national average. Considering the share of employment affected (less than average) in conjunction with the share of businesses (which is the same as the average for Great Britain), this suggests that WMCA firms directly affected by the lockdown could be relatively smaller and hence more vulnerable. The lack of detail in the publicly available statistics makes it impossible to confirm this hypothesis.
Figure 1: Comparison of the direct impact of the COVID-19 lockdown.
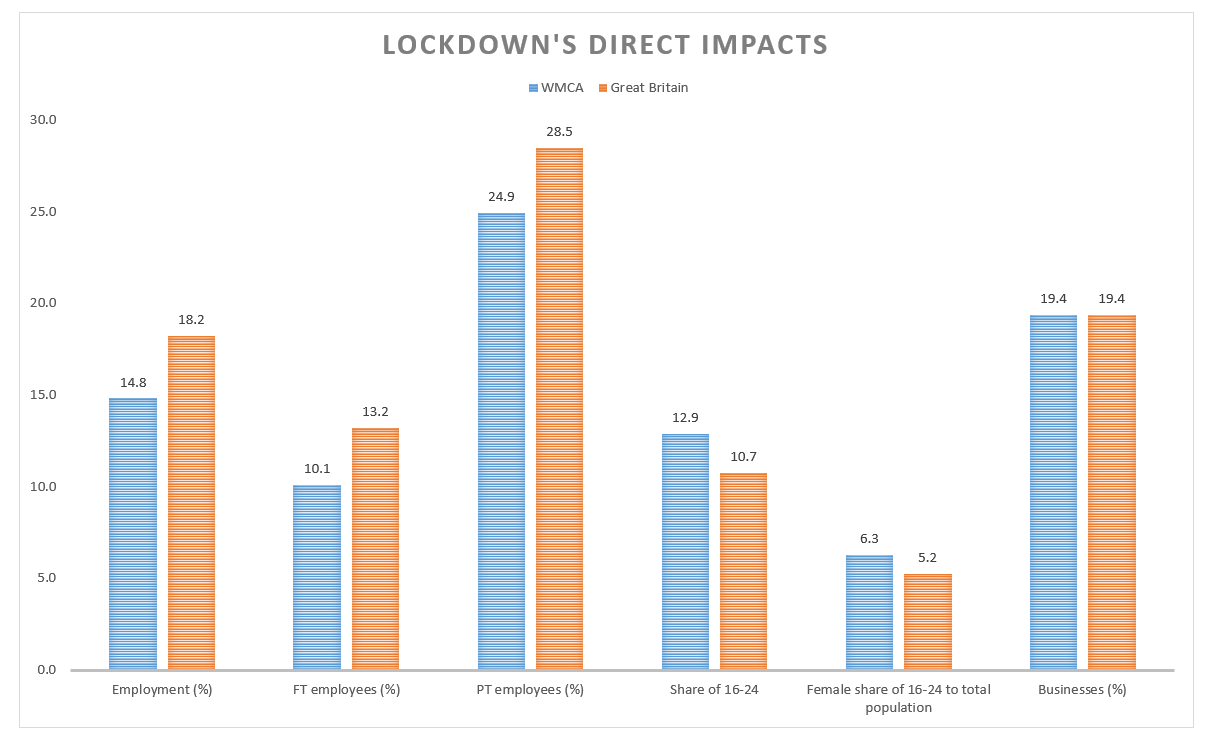
Source: Author’s elaboration of data from the Business Register and Employment Survey, Population Estimates and Inter-Departmental Business Register. Employment (%) – Share of total employment in sectors directly affected by the lockdown. FT employees (%) – Share of total full-time employees in sectors directly affected by the lockdown. PT employees (%) – Share of total part-time employees in sectors directly affected by the lockdown. Share of 16-24 – percentage share of the population, aged 16-24. Female share of 16-24 – percentage share of the female population, aged 16-24. Businesses (%) – the share of total businesses employees in sectors directly affected by the lockdown.
Table 1: Direct employment effects of COVID-19 lockdown
| Type of local area | Name | Employment in danger (number) | Employment (%) | FT employees (number) | FT employees (%) | PT employees (number) | PT employees (%) |
| Combined Authority | West Midlands | 187,590 | 14.8 | 87,500 | 10.1 | 95,175 | 24.9 |
| Local Authority | Birmingham | 80,970 | 15.5 | 40,525 | 11.4 | 39,180 | 25.3 |
| Local Authority | Coventry | 19,590 | 11.9 | 8,095 | 7.2 | 10,970 | 21.6 |
| Local Authority | Dudley | 17,680 | 15.5 | 7,095 | 9.7 | 10,025 | 25.3 |
| Local Authority | Sandwell | 16,440 | 12.8 | 8,355 | 9.4 | 7,780 | 21.3 |
| Local Authority | Solihull | 20,735 | 16.3 | 9,830 | 11.4 | 10,460 | 29.0 |
| Local Authority | Walsall | 15,350 | 13.9 | 7,235 | 9.7 | 7,535 | 22.7 |
| Local Authority | Wolverhampton | 16,755 | 16.1 | 7,580 | 10.8 | 8,935 | 27.6 |
| LEP | Black Country | 66,045 | 14.6 | 30,515 | 9.9 | 34,105 | 23.8 |
| LEP | Coventry and Warwickshire | 67,825 | 14.3 | 27,475 | 8.6 | 36,260 | 25.4 |
| LEP | Greater Birmingham and Solihull | 151,175 | 15.8 | 70,125 | 10.8 | 76,440 | 26.8 |
| Combined Authority | Cambridgeshire and Peterborough | 67,825 | 14.7 | 31,320 | 10.2 | 34,470 | 24.9 |
| Combined Authority | Greater Manchester | 246,165 | 18.0 | 119,135 | 12.9 | 119,650 | 29.3 |
| Combined Authority | Liverpool City Region | 127,500 | 19.6 | 55,540 | 13.5 | 66,685 | 30.3 |
| Combined Authority | North East | 70,630 | 16.2 | 31,725 | 11.0 | 37,330 | 27.3 |
| Combined Authority | North of Tyne | 77,950 | 20.3 | 37,390 | 15.2 | 38,810 | 30.8 |
| Combined Authority | Sheffield City Region | 95,830 | 16.5 | 38,130 | 10.1 | 54,600 | 29.4 |
| Combined Authority | Tees Valley | 44,685 | 17.0 | 19,040 | 11.3 | 24,160 | 27.4 |
| Combined Authority | West Yorkshire | 174,200 | 15.9 | 76,675 | 10.5 | 90,710 | 26.8 |
| Combined Authority | West of England | 87,085 | 16.7 | 38,885 | 11.5 | 45,005 | 26.4 |
| Country | Great Britain | 5,610,650 | 18.2 | 2,662,400 | 13.2 | 2,741,100 | 28.5 |
| Source: Author’s elaboration of data from the Business Register and Employment Survey. Employment (number and %) – Number and share of total employment in sectors directly affected by the lockdown. FT employees (number and %) – Number and share of total full-time employees in sectors directly affected by the lockdown. PT employees (number and %) – Number and share of total part-time employees in sectors directly affected by the lockdown. | |||||||
Table 2: Number of firms and share of population most affected by COVID-19 lockdown
| Type of local area | Name | Share of 16-24 | Female share of 16-24 | Number of businesses | Businesses (%) |
| Combined Authority | West Midlands | 12.9 | 6.3 | 20,530 | 19.4 |
| Local Authority | Birmingham | 14.9 | 7.4 | 8,790 | 20.0 |
| Local Authority | Coventry | 16.6 | 7.8 | 2,160 | 18.0 |
| Local Authority | Dudley | 9.8 | 4.8 | 2,190 | 19.3 |
| Local Authority | Sandwell | 10.6 | 5.0 | 2,015 | 19.0 |
| Local Authority | Solihull | 9.5 | 4.6 | 1,800 | 18.1 |
| Local Authority | Walsall | 10.6 | 5.2 | 1,730 | 19.2 |
| Local Authority | Wolverhampton | 10.7 | 5.1 | 1,780 | 19.9 |
| LEP | Black Country | 7,780 | 19.5 | ||
| LEP | Coventry and Warwickshire | 7,650 | 17.3 | ||
| LEP | Greater Birmingham and Solihull | 16,480 | 19.0 | ||
| Combined Authority | Cambridgeshire and Peterborough | 10.9 | 5.2 | 7,125 | 16.7 |
| Combined Authority | Greater Manchester | 11.5 | 5.6 | 27,090 | 22.1 |
| Combined Authority | Liverpool City Region | 11.5 | 5.7 | 12,115 | 23.2 |
| Combined Authority | North East | 10.8 | 5.2 | 8,300 | 23.3 |
| Combined Authority | North of Tyne | 12.4 | 6.0 | 7,385 | 23.8 |
| Combined Authority | Sheffield City Region | 12.2 | 5.9 | 9,865 | 20.9 |
| Combined Authority | Tees Valley | 10.5 | 5.0 | 4,750 | 21.2 |
| Combined Authority | West Yorkshire | 12.0 | 6.0 | 18,695 | 20.3 |
| Combined Authority | West of England | 14.5 | 7.2 | 8,195 | 18.3 |
| Country | Great Britain | 10.7 | 5.2 | 598,090 | 19.4 |
| Source: Author’s elaboration of data from the ONS Population Estimates and Inter-Departmental Business Register. Share of 16-24 – percentage share of the population, aged 16-24. Female share of 16-24 – percentage share of the female population, aged 16-24. Businesses (number and %) – number and share of total businesses employees in sectors directly affected by the lockdown. | |||||
This blog was written by Dr Tasos Kitsos, Research Fellow, City-REDI / WM REDI, University of Birmingham.
To sign up for our blog mailing list, please click here.
Disclaimer:
The views expressed in this analysis post are those of the authors and not necessarily those of City-REDI or the University of Birmingham