Alice Pugh provides a breakdown of the first round of Levelling Up funding. Which regions were the big winners, and who lost out in the first round?

View a blog summarising round two funding.

View more of our work on Levelling Up
In Levelling Up (LUP) round one, 105 projects were funded, at a total value of £1.7bn. The purpose of this funding is to help areas which are seen as being ‘left behind’, places which have poorer performance on key economic and social indicators.
Regional analysis
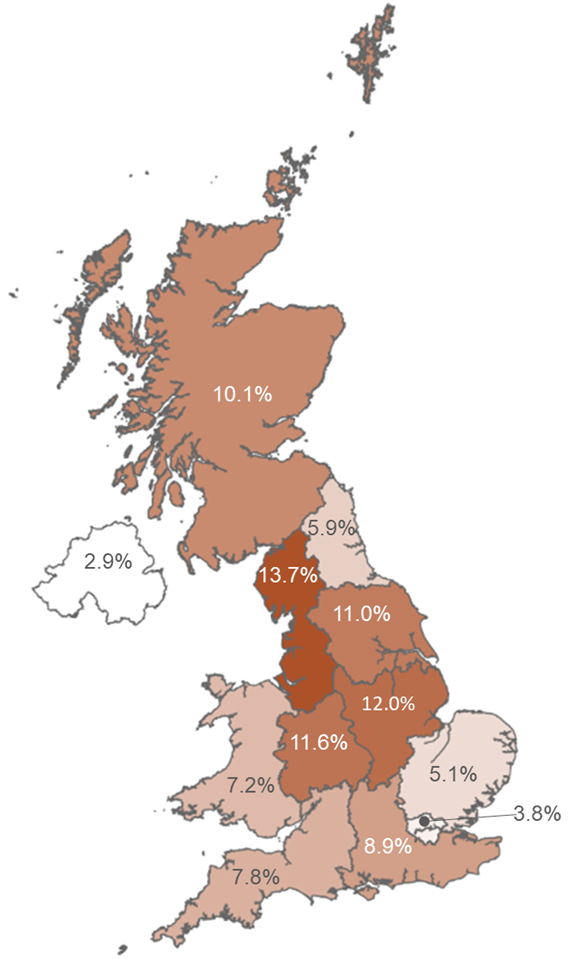
The region which received the majority of funding from the LUP pot was the North West, which received 13.7% of the total funding available. Northern Ireland received the least funding, winning only 2.9% of the total funding available, as seen in Figure 1. Overall, the North West, the Midlands and Yorkshire and the Humber received the majority of funding within this round.
Figure 1: Allocation of Levelling Up funding by region and devolved nation, round 1.
Spend per Capita
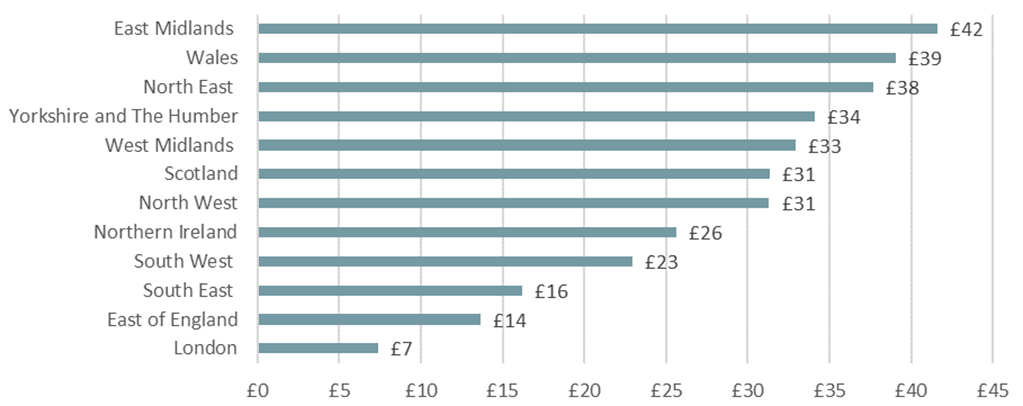
In terms of spend per person (capita) the East Midlands saw the highest spending at £42 per capita, followed by Wales (£39) and the North East (£38). The region with the lowest spend per capita was London (£7), followed by the East of England (£14) and the South East (£16). This would suggest that per head, regions generally seen as left behind did see more funding than other regions.
Figure 2: Levelling Up Spend per Capita by Region, round 1
Party Political Divide
The largest number of successful projects were based within Labour constituencies: 41 (41.8%). Areas with Conservative MPs won a similar number of bids (40.8%)
Figure 3: Number of projects awarded by Political Party based on the location of awarded projects, round one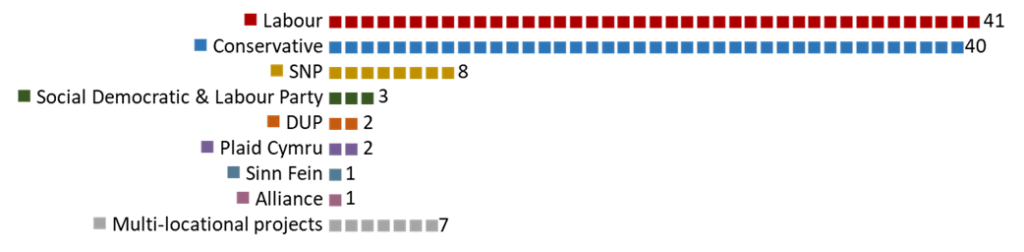
Source: WMREDI analysis based on data from Department for Levelling Up, Housing and Communities, 2021Almost 25% of projects were in constituencies not associated with either of these parties (e.g. in Scotland and Northern Ireland). 7 of the projects were multi-locational projects; these were mostly large-scale transportation projects, which span and impact multiple constituencies with different political party affiliations.
Priority Areas
The government provided ratings by local authority (LAs) based on their levelling up needs: areas with a rating of one were considered in most need, down to priority rating three areas which were deemed as areas in the least need of levelling up. However, not all local authorities within the UK were given a priority rating; many geographies in Scotland, Wales and Northern Ireland were omitted. In total 20 local authorities which had not been given a priority rating won a project; this is denoted by the zero category in Figure 4.
Figure 4: Number of projects by priority rating, 0 to 3
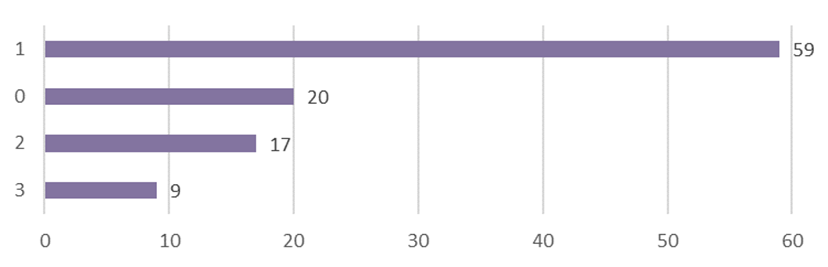
Of the LAs that did receive a priority rating, 56.2% (59) had a priority rating of one. 17 (16.2%) had a priority area rating of two and only 9 (8.6%) of successful projects were given a rating of three.
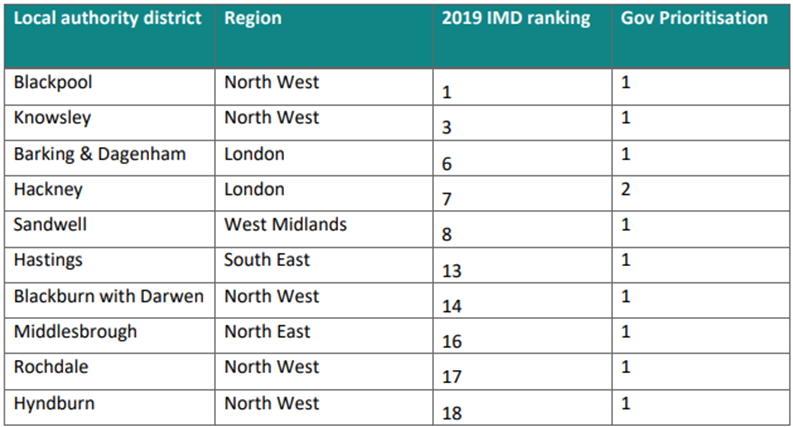
The Centre for Levelling Up found that even though some areas were listed as priority one, with high levels of deprivation, they missed out on the first round of funding. For instance, Blackpool and Knowsley are the 1st and 3rd most deprived areas based on their Index of multiple deprivation rating, but both missed out in the first round of funding.
Figure 5: 10 most deprived local authority districts that did not receive LUF
Indices of Multiple Deprivation
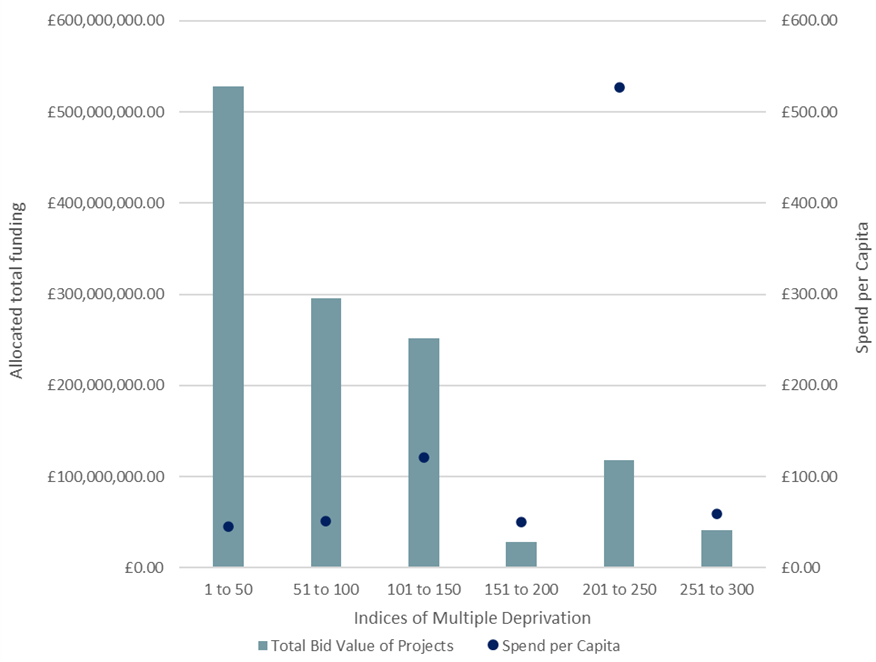
At a more spatially-disaggregated level, the graph below shows the distribution of funding by Indices of Multiple Deprivation rank grouping. The data used in this graph do not include funding awarded to Scotland, Wales or Northern Ireland.
LAs in the most deprived group (1 to 50) received the majority of funding, receiving 41.8% of total funding awarded to LAs in England. However, LAs ranked in the most deprived grouping also had the lowest spend per capita at £45.79. Therefore, even though this group was allocated the most funding in total, per person these LAs have received the least funding.
The second most deprived group (51 to 100) received the second largest allocation of funding at 23.4%, with a per capita spend of £51.76. The third most deprived group (101 to 150) received 19.9% of funding, with a spend per capita of £120.84. The 4th group (151 to 200) won 2.2% of funding, at a spend per capita of £50.31. In the 2nd least deprived group (251 to 300) LAs won 3.3% of funding, with a spend per capita of £59.66. LA’s which had the lowest levels of deprivation (ranked 300+) did not receive any money in this round.
The real outlier in is the 3rd least deprived group (201 to 250) which received 9.3% of total funding awarded in England, with a spend per capita of £526.54. There were actually only three projects won by LA’s in this group, both South Derbyshire and Isles of Scilly won almost £50m each, the largest two winning bids of all local authorities in round one. The Isle of Scilly is particularly an outlier amongst the other LAs as it won a £48.4m bid, however, its total population is 2,271, meaning the spend per capita was £21,331.
Figure 6: Allocation of funding and Spend per Capita by LA Indices of Multiple deprivation ranking, round one
Did ‘left behind’ areas receive the most Levelling Up funding?
Whilst regions which are generally considered the most left behind did win the most funding, such as the North West, it was not necessarily the most deprived areas intra-regionally which received the funding. Drilling down into spend at a more granular geographical level, spend per head was much higher in less deprived areas than in the most deprived areas.
View more Levelling Up work from WMREDI.
This blog was written by Alice Pugh, Policy and Data Analyst for City REDI and WM REDI.
Disclaimer:
The views expressed in this analysis post are those of the authors and not necessarily those of City-REDI or the University of Birmingham.