Alice Pugh provides a breakdown of the latest round of Levelling Up funding. Which regions were the big winners, and who lost out this time around?

View our analysis of Round One funding.

View more of our work on Levelling Up
In the second round of levelling up funding, 111 projects were awarded funding, with a total value of £2.1bn. The purpose of this funding is to help areas which are seen as being ‘left behind’; places which have poorer performance on key economic and social indicators.
Regional Analysis
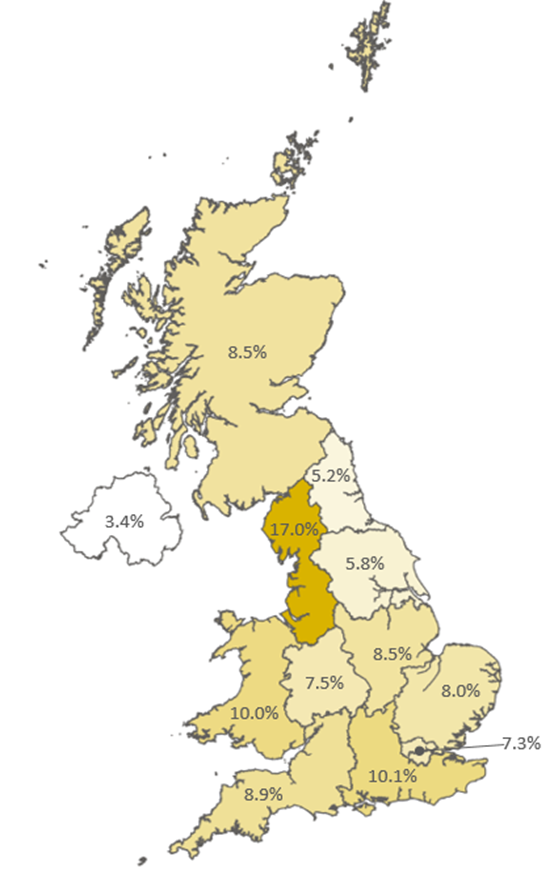
In the second round of levelling up funding, the North West again saw the largest allocation of funds out of the UK regions, winning 17% of total funding. The North West received a much higher proportion of funding than other regions, with the region receiving 5.9% more than the region with the second largest allocation – the South East at 10.1%. Northern Ireland was allocated the least funding at 3.4% of total funding in round two, having also received the least amount of funding in round one.
Figure 1: Allocation of Levelling Up funding by region, round two
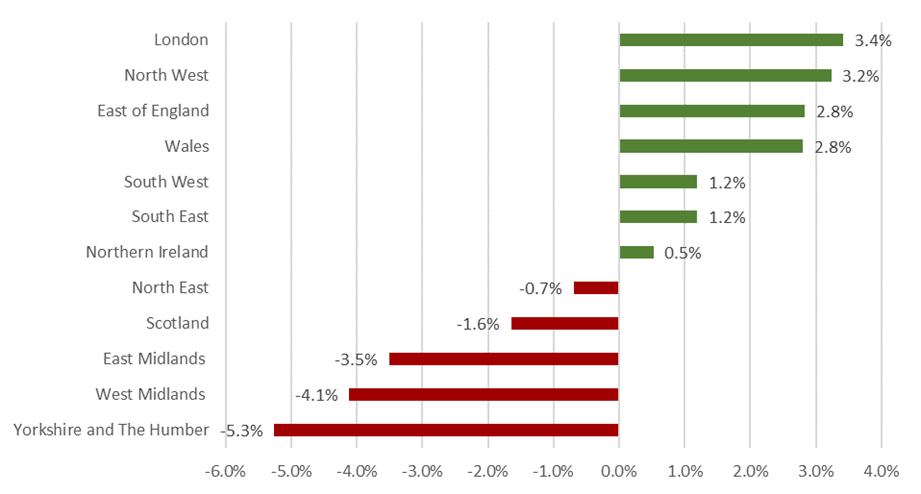
The graph below shows the proportion of funding allocated by region. The areas which saw the largest decrease in funding allocation were Yorkshire and the Humber (-5.3%), the West Midlands (-4.1%) and the East Midlands (-3.5%). However, these regions received the most funding after the North West in round one. However, there was a shift in funding in this round, with more funding to the southern parts of the UK compared to the first round of funding. Although, in the first round London and the East of England did receive lower levels of funding.
Figure 2: Change in share of the allocation of funding between Levelling Up rounds one and two
Spend Per Capita
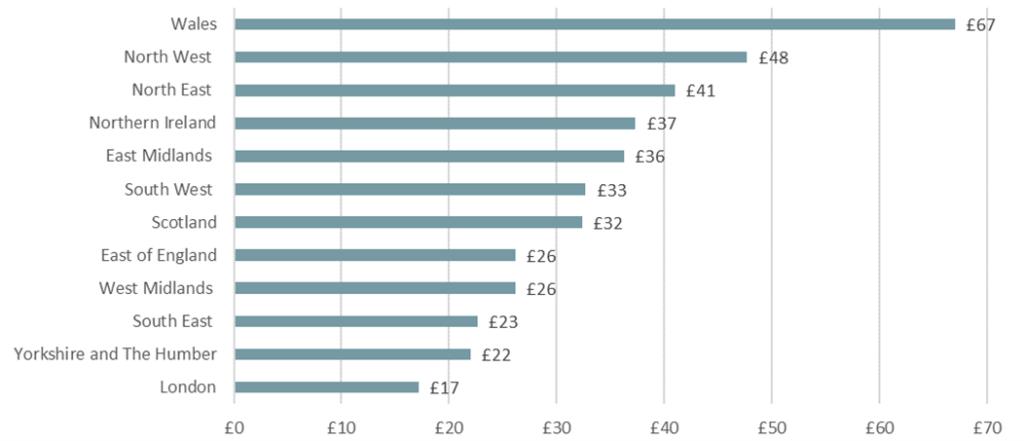
The Prime Minister claimed last week that levelling up spending per capita was higher in the North than in the South. In terms of spend per capita spending, Wales received the most funding at £67 per capita, the North West had the second largest per capita spend at £48, followed by the North East at £41 per capita. London again received the smallest spend per capita at £17 and the South East had the third smallest spend per capita at £23. The outlier in the North-South divide was Yorkshire and the Humber which had the second lowest spend per capita at £22.
Figure 3: Levelling Up Spend per Capita by Region, round two
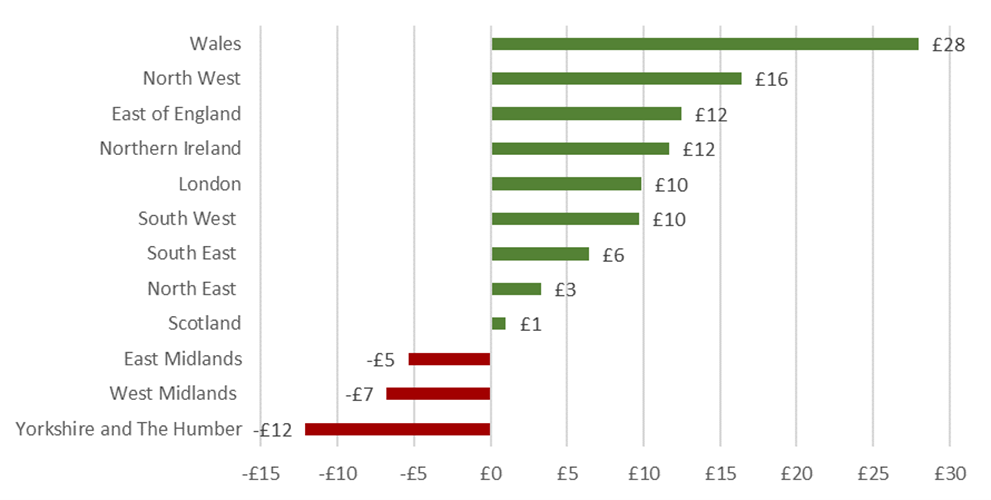
Wales saw the largest uplift in per capita spending, seeing a significant £28 increase per head. The North West also saw a significant increase of £16 from £31 per capita in round one to £48 per capita in round two. Out of the total 12 regions, nine saw an increase in per capita spend, the three regions which saw a decrease were Yorkshire and the Humber (-£12), the West Midlands (-£7) and the East Midlands (-£5). However, the East Midlands did receive the highest spend per capita in round one.
Figure 4: Change in per Capita Spend from round one to round two, by region
Source: WM REDI analysis based on data from Department for Levelling Up, Housing and Communities, 2023
Party Political Divide
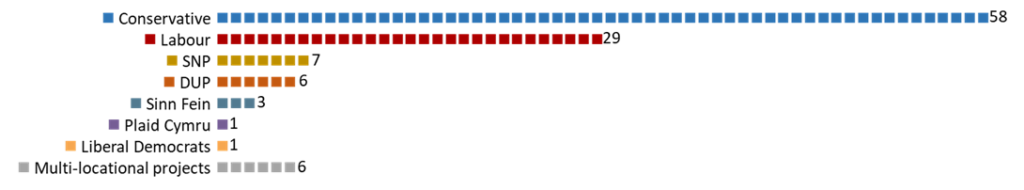
Based on the location of successful projects in this round, most projects were based within Conservative constituencies, with 58 (52.3%) successful projects, whereas the number of successful projects in Labour constituencies was 29 (26.1%). In round one, 41.8% of successful projects were based in Labour constituencies and 40.8% in Conservative constituencies. Hence in round two, there was a shift towards Conservative constituency-based projects.
Figure 5: Number of projects awarded by Political Party based on the location of awarded projects, round two
One of these projects was awarded to Blackpool which is the most deprived area of the UK based on its average rank on the Indices Multiple of Deprivation (IMD). Only one other Conservative constituency which won a project was in the top 10 most poorly ranked on IMD. 24 of the 58 (41.4%) successful projects in Conservative constituencies were in the top 100 most deprived local authorities in the UK.
Priority Areas
The government provided a rating by local authority (LA) based on their levelling up needs: areas with a rating of one were considered in most need, down to priority rating three areas which were deemed as areas in the least need of levelling up. However, not all local authorities within the UK were given a priority rating; many geographies in Scotland, Wales and Northern Ireland were omitted. In total 16 local authorities had not been given a priority rating but won a project. This is denoted by the 0 category in Figure 6.
Figure 6: Number of projects by priority rating, 0 to 3
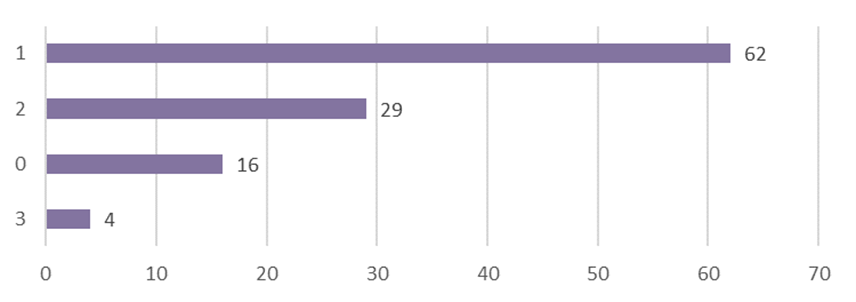
Of the LAs that did receive a priority area rating, 62 (55.9%) had a priority rating of one. 29 (26.1%) had a priority area rating of two and only 4 (3.6%) successful projects were given a rating of three.
Indices of Multiple Deprivation
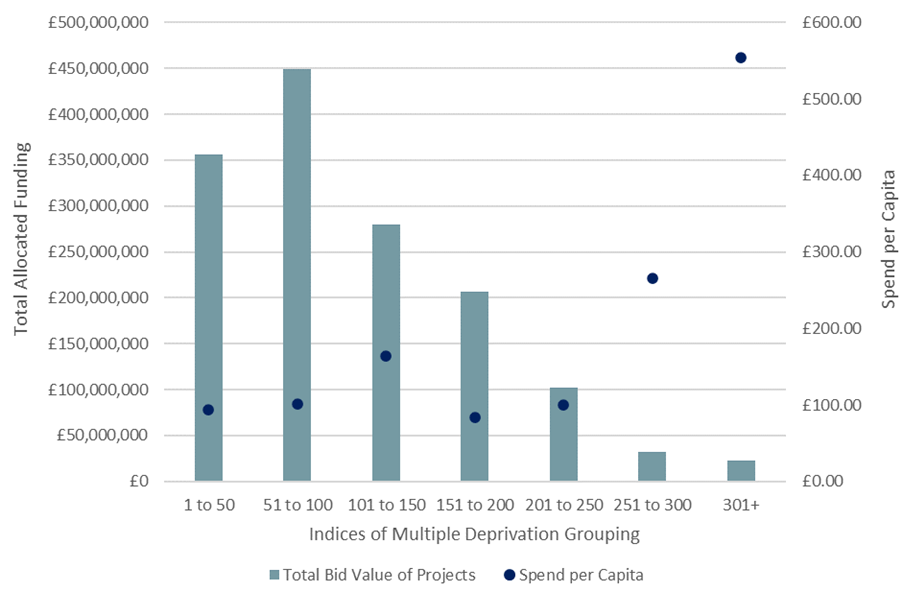
At a more spatially disaggregated level, the graph below shows the distribution of funding by Indices of Multiple Deprivation rank grouping. The data used in this graph does not include funding awarded to Scotland, Wales, or Northern Ireland, as the Indices of Multiple Deprivation does not include data for these areas.
In the second round of funding the second most deprived group (51 to 100) won the most of the funding at 31%, with a per capita spend of £101.67. This differs from the first round when the most deprived LAs won the majority of funding, in this round they won 24.6% with an average spend per capita of £94.21. However, round two funding rules show that funding awarded in round one impacted the second round of funding. The levelling up round two guidance states that ‘any successful bids a place has had in the first round will be subtracted from their bid allowance in the second round’. Only two LAs in Northern Ireland won a bid in each round; no LAs in England, Scotland or Wales, won a bid in both rounds.
The third most deprived group of LAs received 19.3% of total funding, at a spend per head of £164.18. LA’s in England which ranked between 151 to 200 on IMD, received 14.3% of total funding allocated however, it had the smallest spend per capita at £83.33. Then those in the third least deprived group (201 to 250), received only 7% of total funding, with a spend per capita of £99.66.
The least two deprived LA groups (251 to 300 and 301+) won the least funding at 2.2% for the second least deprived group and 1.6% for the least deprived group. However, in terms of spend per capita both these groups had the highest spend. For the 251 to 300 least deprived LAs the spend per capita was £265.34 and for the least deprived group (301+) the spend per capita was £554.62.
The regions considered as more ‘left behind,’ such as the North West, had the highest spend per capita. However, at the intra-regional the picture is a bit more blurred, since the spend per capita at a local authority level is generally much higher in less deprived LAs.
Figure 7: Allocation of funding and Spend per Capita by LA Indices of Multiple deprivation ranking, round two
Did ‘left behind’ areas receive the most funding?
As in round one, most of the funding generally went to ‘left behind’ regions. However, again looking at a more granular geographical level there was a lower spend per capita in more deprived local authorities than in less deprived local authorities. For example, Middlesborough is ranked 13th on the IMD and received no funding in either round, while Richmondshire is ranked 251 on the IMD and received £19m in levelling up funding.
View more of our work on Levelling Up
This blog was written by Alice Pugh, Policy and Data Analyst for City REDI and WM REDI.
Disclaimer:
The views expressed in this analysis post are those of the authors and not necessarily those of City-REDI or the University of Birmingham.