
In this blog, Dr Okan Yilmaz, Professor Sasha Talavera and Dr Joy Jia examine the impact student housing demand has on rental markets in Birmingham and Coventry and how COVID-19 might change this.
As with many other markets, the real estate market follows predictable seasonal patterns every year. It heats up during hot periods and winds down in cold periods. That is, a more liquid UK property market is observed in the hot season when both prices and the number of transactions increase (Ngai and Tenreyro, 2014). Whilst the fluctuations in the sale market is well-documented, there is less evidence available for the rental market. In the UK, the private rental market accounted for about 20% of households and about 4.6 million people live in privately rented houses (English Housing Survey, 2018-19).
Focusing on the effect of student housing demand, we investigate changes in rental markets across time and locations within the cities in the UK (Yilmaz et al., 2020). Understanding the dynamics of the rental market is of great interest to tenants, landlords, agents and policymakers, particularly amid the Covid-19. In 2020-2021 academic year many universities will either move completely online (e.g. Cambridge University) or provide blended learning (e.g. University of Birmingham). Hence the analysis could shed some light on what will happen with the rental market within the next few months.
More precisely, we explore how liquidity differs for houses with respect to their distances from the university campuses in 13 major cities, including Birmingham, Leeds, Glasgow, Bristol, Liverpool, Manchester, Sheffield, Edinburgh, Cardiff, Coventry, Newcastle, Nottingham, and Plymouth. The data come from Zoopla.com and the Urban Big Data Centre (UBDC) and cover 2015-2017 period.
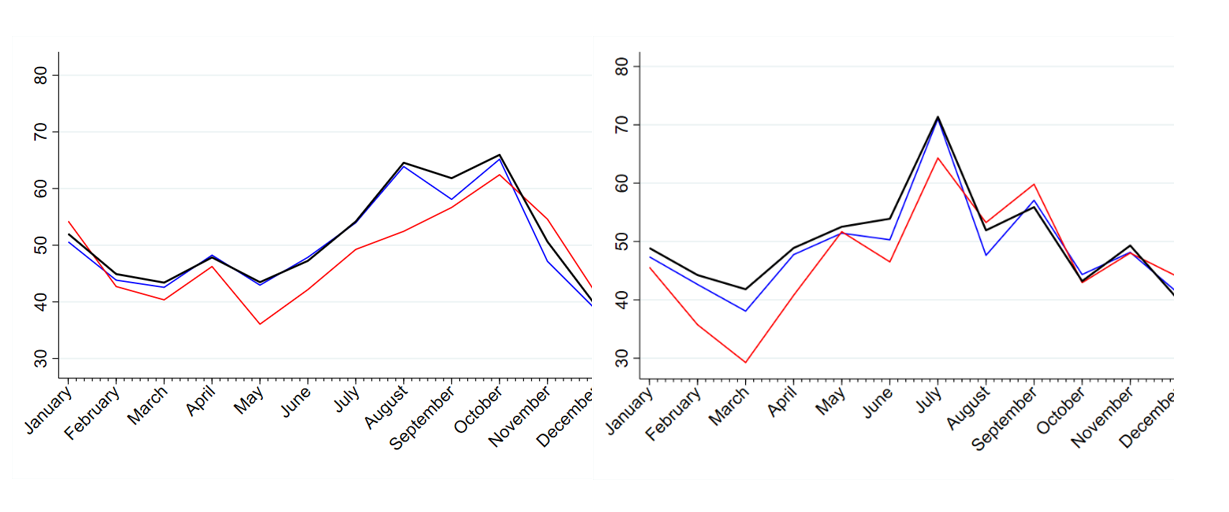
We found that rental markets show similar patterns to sale market in terms of liquidity across all cities. For instance, the Birmingham rental market is more liquid in late summer and early autumn as shown in Figure 1. More specifically, in July and October, the average entry ratio is about 65% at its peak, in comparison to 43% in March at its lowest. The average exit ratio is also at its lowest in March, below 40%, whereas the peak time of the average exit ratio is in July above 70%. Although Coventry seems to have similar periodic patterns, liquidity is smaller compared to Birmingham and the country.
Figure 1. Entry and exit ratios – Panel A: Entry Ratio / Panel B: Exit Ratio
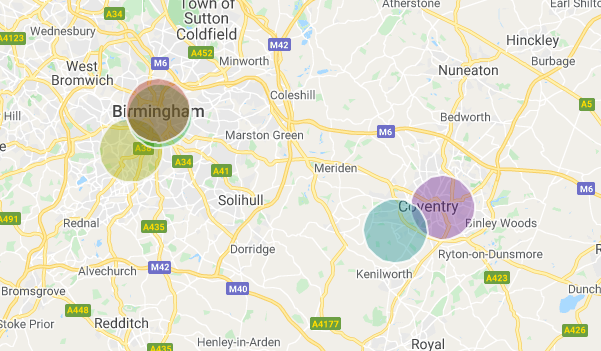
Birmingham has a large student population which accounts for 3% of the higher education students in the UK (HEAS, 2020). It is reasonable to expect that student housing demand affects rental markets. Particularly, this effect should be more visible in certain times of the year, such as the start of the academic term, and certain locations, such as areas closer to the campuses. Among three universities in Birmingham, Aston University and Birmingham City University are located close to the city centre while the University of Birmingham, which is one of the largest universities in terms of the number of students in the UK, is located in Edgbaston, slightly outside the city centre. In Coventry, two major universities are in different parts of the city – Coventry University being in the city centre and the University of Warwick being in the southwest of the city. (see Figure 2).
Figure 2 University Campuses in Birmingham and Coventry
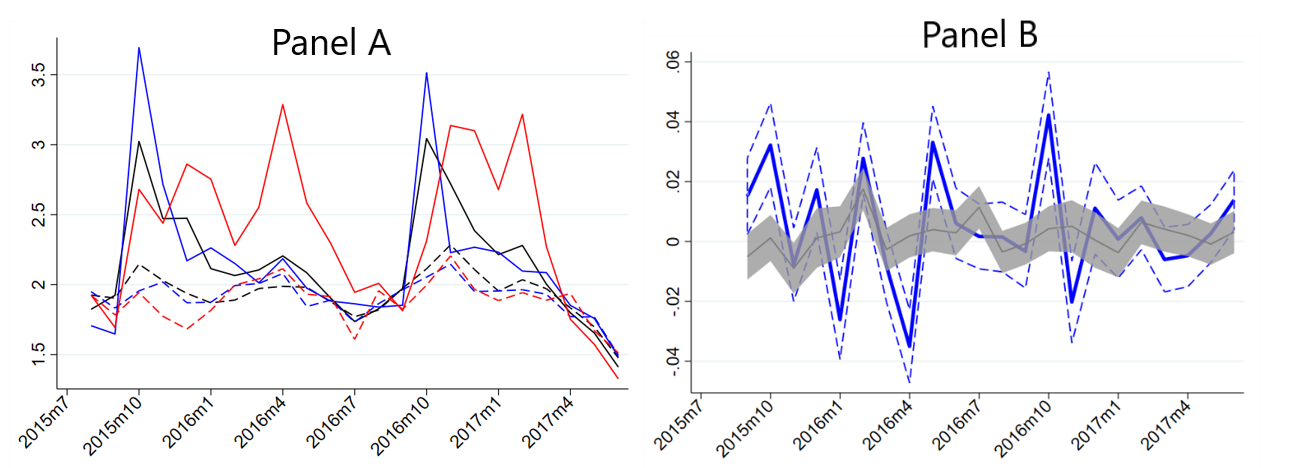
Looking at how time on market (TOM-the length of time a rental listing stays on the market in terms of months) and rental prices vary in different locations in the city and across the year, our results point that student housing demand indeed affects rental markets dramatically (see Figure 3). For both Birmingham and Coventry, TOM for the properties 3-km further away from campuses is relatively constant throughout the year. However, within 3-km, TOM shows a substantial variation. Notable peaks are observed around October and November, which coincides with the start of the academic term. Houses that enter the rental market after the start of the academic term stay on the market around one month longer than the average. The variation in the rent of the properties within 3-km to a university is also noticeably higher than that is observed outside this range. This indicates that student housing demand plays an important role in the rental market in Birmingham and Coventry. Coventry is likely to be particularly affected as the TOM for properties close to universities stays at 3-month levels between the start of the academic terms and next summer season.
Figure 3. Liquidity and Prices
Understanding the fluctuations in rental markets in major UK cities such as Birmingham and Coventry can be vital for landlords, renters, investors, and policymakers. For instance, the strong effect of the start of the academic term points to heavy reliance on the private rented sector by students. However, the situation is likely to change in Autumn 2020, where most of the UK universities are likely to face reduced demand for their services. Therefore, we are likely to observe another consequence of COVID-19 pandemic.
This blog was written by Dr Okan Yilmaz, Swansea University, Professor Sasha Talavera, University of Birmingham and Dr Joy Jia, Swansea University.
Disclaimer:
The opinions presented here belong to the author rather than the University of Birmingham.
To sign up for our blog mailing list, please click here.