
Maryna Ramcharan and Abigail Taylor examine the National Minimum Wage in terms of how it compares to minimum wage rates internationally, its national impact and its implications for the West Midlands.
The 1st of April 2022 marks the 23rd year since the introduction of the National Minimum Wage (NMW) in the UK by Tony Blair’s Labour government in 1999. The day is also notable as it sees the minimum wage rise for workers across the UK. For over 23s, the National Living Wage (NLW, introduced in 2016) will rise from £8.91 to £9.50 per hour. For those aged 21-22 and for whom the NMW still exists, the NMW rate will rise from £8.36 to £9.18, whilst for workers aged 18 to 20, it will rise from £4.62 to £4.81. The Apprentice rate will rise from £4.30 to £4.81.
Described as “one of the most significant labour market interventions” made by Blair’s government, it increased the pay of well over one million low paid workers by about 15% overnight at the point of introduction. Initial fears that the introduction of the minimum wage would lead to an overall loss of jobs have proved unfounded. Indeed, a review of international evidence on the impacts of minimum wages for the Treasury, found that recent evidence from the US, UK and other developed countries “points to a very muted effect of minimum wages on employment, while significantly increasing the earnings of low paid workers”. Even during periods of recession, employers appear to “absorb” minimum wage increases through higher prices, lower profits and increased worker productivity as opposed to laying off staff.
Nonetheless, what have the implications of the introduction of the minimum wage been over the longer term? This blog:
- compares the generosity of the minimum wage rate across international countries,
- examines trends in the NMW/NLW versus real hourly pay,
- considers the proportion of workers who receive the minimum wage, which types of workers mainly receive it.
How does the National Minimum Wage in the UK compare to Minimum Wage rates internationally?

Trends in National Minimum Wage and National Living Wage vs Real hourly pay
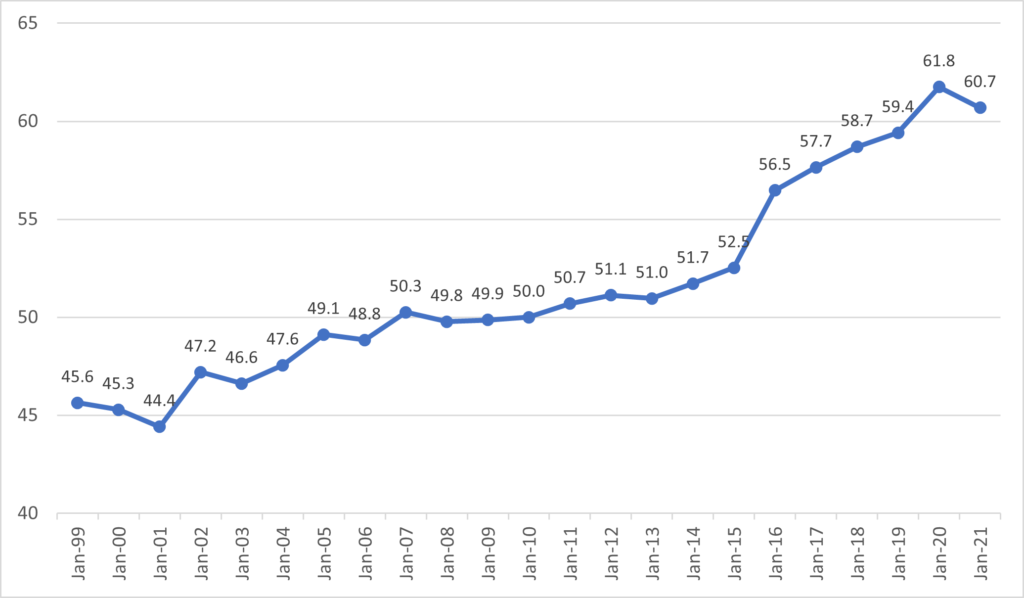
The ‘bite’ of the minimum wage relates to the ratio of NMW/NLW to median hourly earnings. The data shows that the bite has followed an increasing trend over time. Analysis by the Institute for Fiscal Studies indicates that the introduction of the NLW (which increased the minimum hourly monthly pay from £6.50 to £7.20 per hour) led to an increase in the ‘bite’ of the minimum age the level of the minimum wage as a fraction of the median wage) for individuals aged 25+ that exceeded the increase over the previous 16 year period since the introduction of the NMW.
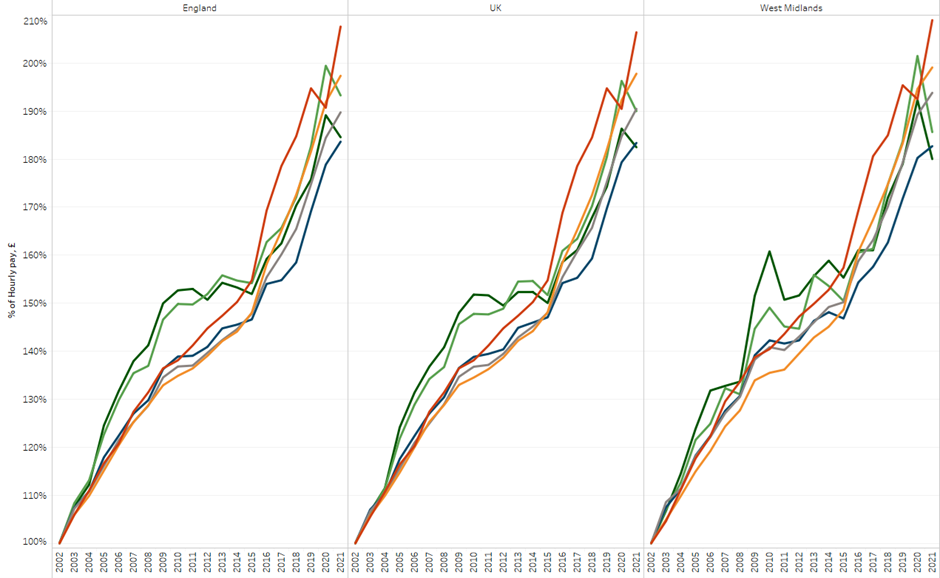
Hourly pay growth shows that hourly rates for full-time workers have grown at a faster pace at lower percentiles. This is ‘pro-poor growth’ according to Klasen who defines pro-poor growth as growth that maximises the income gains of the poor. This means that the income growth rate of the poor must exceed the growth rate of the non-poor. In such a case, reduction of poverty goes hand in hand with a reduction in inequality. However, the picture is different for part-time workers (Figure 3). Hourly pay of upper percentiles grew at a faster rate than the hourly pay of the 10th percentile from 2004 to 2019, as well as in the first year of the recent pandemic.
What proportion of workers receive the NMW/NLW nationally and regionally?
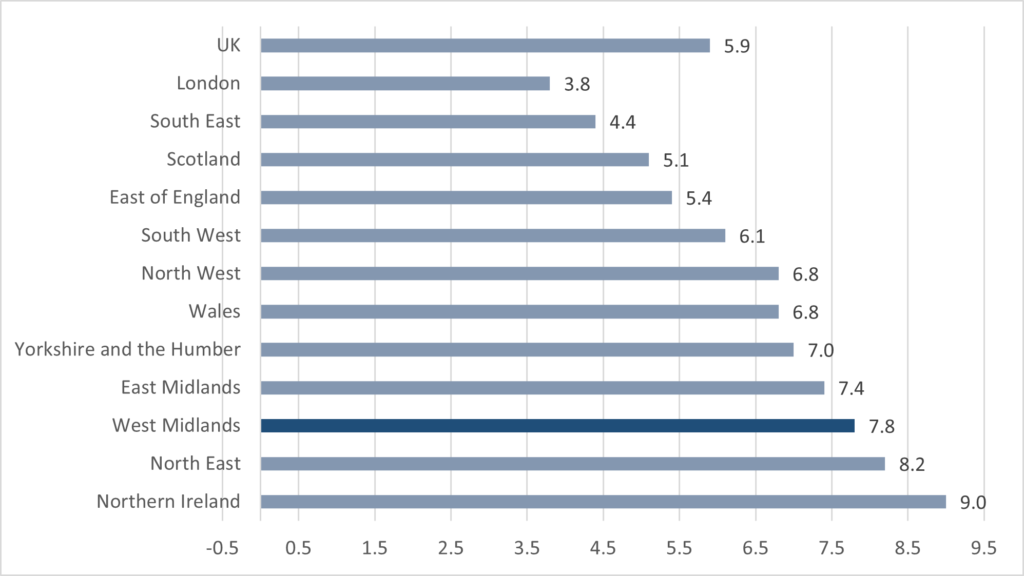
As shown in Figure 2, 5.9% of workers nationally currently receive either the NMW or the NLW. The proportion differs across the UK, being highest in Northern Ireland at 9% and lowest in London at 3.8%. Regions with a higher share of minimum wage workers generally have a higher proportion of low-paid workers. This indicates that a strong connection exists between the share of minimum wage workers and the strength of the local economy and its industrial/occupational composition.
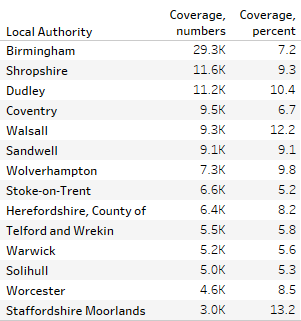
Across England, the West Midlands stands out for the high proportion of workers receiving the NMW or NLW, indicating a need to focus on creating high quality higher paid employment. 7.8% of workers aged above 16 are currently paid the NMW/ NLW in the West Midlands which is a higher proportion compared to the UK. The West Midlands ranks third in coverage of the NMW/NLW rates for workers 16+ following Northern Ireland and the North East. Most workers claiming NMW or NLW (over 29,000 workers) live in Birmingham, reflecting the size of the local authority area. The parts of the West Midlands which have the highest proportions of workers receiving the NMW/NLW are Staffordshire Moorlands, Walsall, and Dudley.
Who is being paid the NLW and what are the implications of this for the West Midlands?
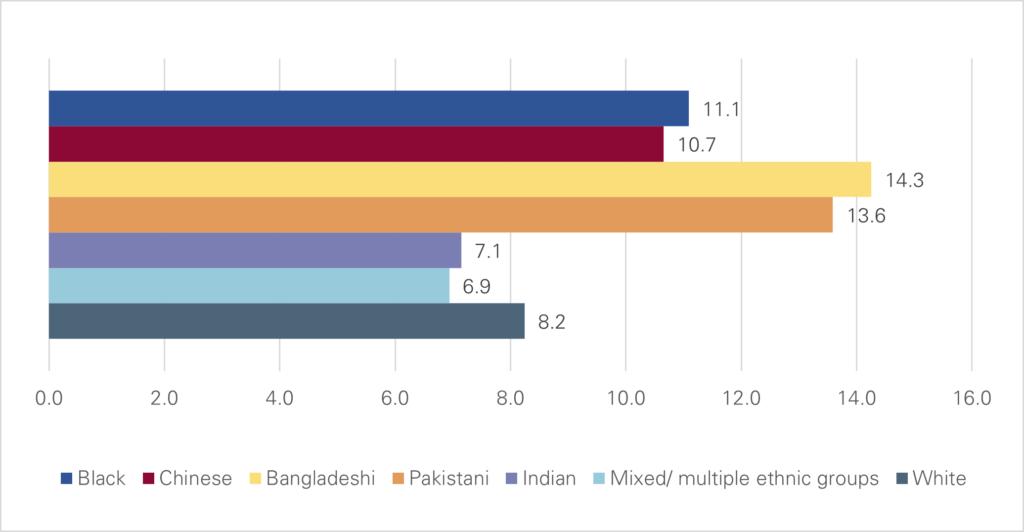
According to the Low Pay Commission (LPC) data, the proportion of people receiving the NLW differs according to ethnicity. It is highest amongst people of Bangladeshi and Pakistani origin and lowest amongst workers of mixed ethnicity or of Indian origin. This trend has important implications for the West Midlands as the West Midlands has a higher proportion of Bangladeshi/Pakistani residents than the UK population average (3.9% compared to 2%). There were 14.3% of Bangladeshi people being paid minimum wage in the UK at the beginning of 2020 followed by 13.6% of Pakistani people and 11.1% of black people.
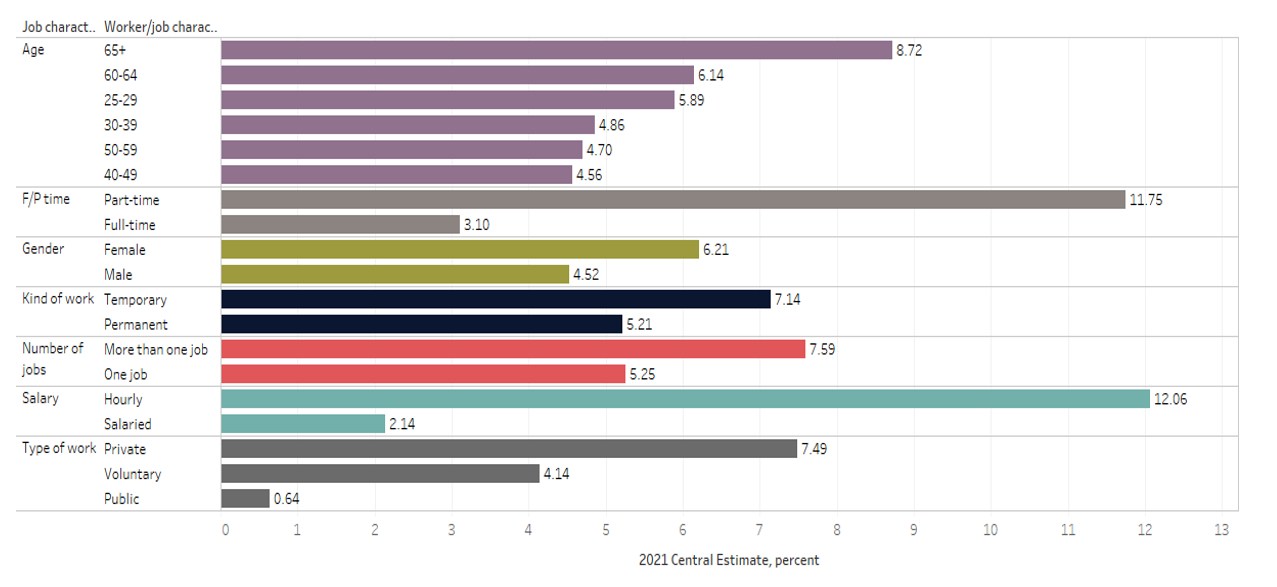
Also, data shows that females and people over 60 years old are more likely to be on minimum wage pay. This also applies to those who work privately, do temporary or part-time jobs and those being paid on an hourly basis. The proportion of females and people aged over 60 in the West Midlands is close to the national average.
The importance of up-skilling and re-skilling
Overall, this blog shows how:
- the value of the minimum wage in the UK compares quite favourably to that in other countries
- the hourly rates for full-time workers have grown at a faster pace at lower percentiles
- the proportion of people receiving the NLW differs according to ethnicity and is highest amongst workers of Bangladeshi and Pakistani origin
- the West Midlands stands out (after the North East) for the high proportion of workers receiving the NMW or NLW compared to other regions in England.
The West Midlands 2021 State of the Region report emphasises the importance of stakeholders within the region focusing on “delivering good jobs”, arguing that “there is a need to create purposeful jobs that provide a route out of poverty and aid a just transition to net-zero”. The WM2041 Five Year Plan identifies a potential for 21,000 jobs to be created by 2026 and another 71,000 jobs to be created by 2041 as part of the transition to net-zero. Ensuring adequate opportunities for up-skilling and re-skilling will be essential to enabling workers to move into the newly created roles and reducing the proportion of individuals in minimum wage roles in the West Midlands.
This blog was written by Dr Abigail Taylor, Research Fellow, City-REDI / WMREDI, University of Birmingham and Dr Maryna Ramcharan, from the West Midlands Combined Authority.
Disclaimer:
The views expressed in this analysis post are those of the authors and not necessarily those of City-REDI, WMREDI or the University of Birmingham.