With bankruptcies on the rise in the UK, Simon Collinson, Matt Lyons and Huanjia Ma look at the impact of firm failure on the economy, employment and households.
Data released by the Insolvency Service at the end of January shows that firm insolvencies, or bankruptcies, in England and Wales reached the highest level since 2009.
Lower-skilled, lower-income households in more deprived communities are less resilient than wealthier households and tend to experience higher unemployment in times of recession. There are fewer opportunities for re-employment in new firms or growth industries, less disposable income for re-location and a lower level of assets and savings to draw on to carry them over into the next upturn. High insolvency rates correlate with increased social welfare benefits costs for governments.
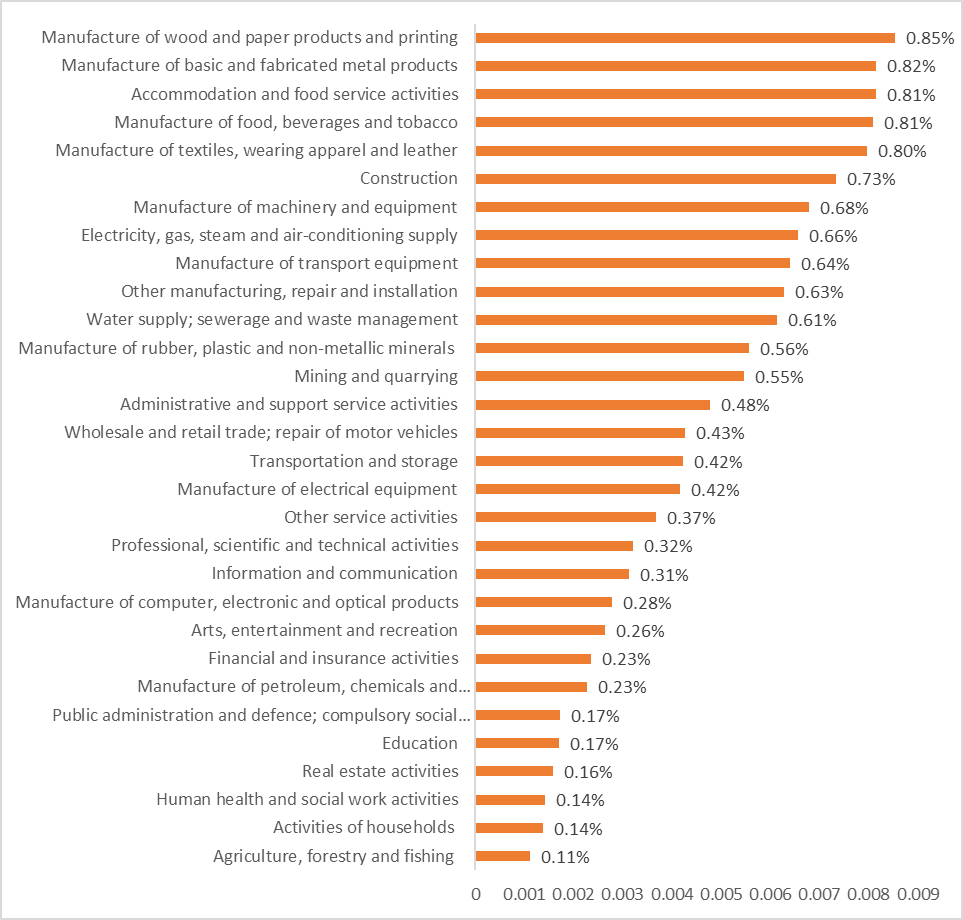
In 2022, 22,109 firms in England and Wales and an additional 1,062 firms in Scotland became insolvent. Firms in manufacturing sectors were affected the most. As shown in Figure 1, the five industries (SEIM-UK industry classification based on SIC 2007) that experienced the highest percentage of insolvencies in 2022 were Manufacture of wood and paper products (0.85%), Manufacture of basic and fabricated metal products (0.82%), Accommodation and food service activities (0.81%), Manufacture of food beverages and tobacco (0.81%) and Manufacture of textiles, wearing apparel and leather (0.8%). The top 5 in terms of the total number of firms were: Construction, Wholesale and retail trade, Accommodation and food service activities, Administrative and support service activities and Professional, and scientific and technical activities. Apart from the last on this list, these sectors (listed by percentage or numbers of firms) tend to employ lower-skilled and lower-income employees.
Figure 1: Firm insolvencies by industry (% of the total in each sector)
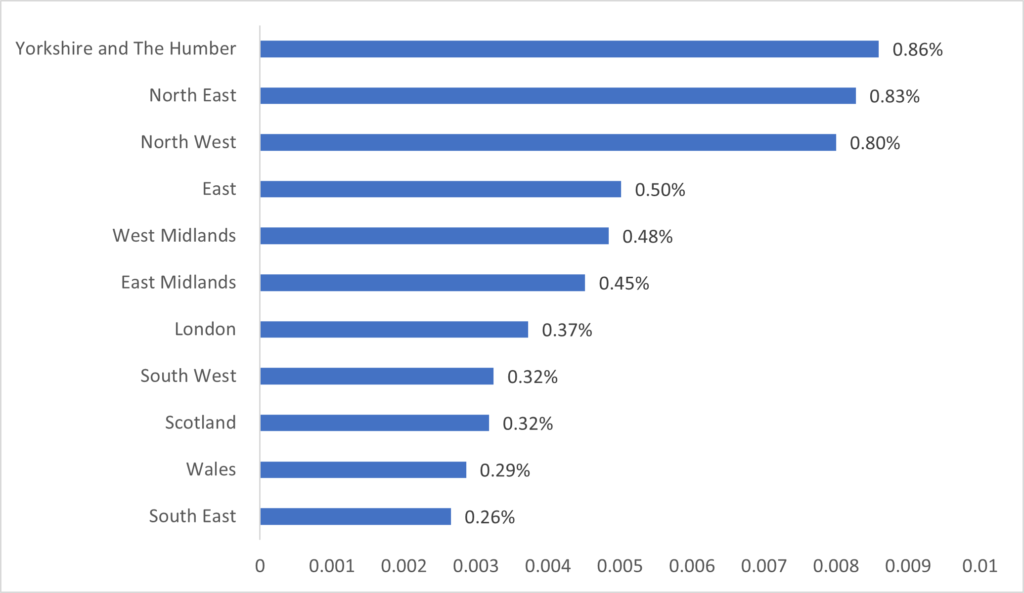
If we examine data at the NUTS 1 region level, in terms of the number of employees per firm that went insolvent (Figure 2), the three worst-affected regions are Yorkshire and the Humber (0.85% of all firms), North East (0.83%), and North West (0.8%).
Figure 2: Firm insolvencies by NUTS 1 region
The impact on productivity (GVA)
An external shock to one region or sector can have substantial effects across regions and industries given their close interconnectedness. We examine these knock-on effects using the extended SEIM-UK model, developed at City-REDI. By internalising (endogenizing) household consumption and income within the model, we are able to simulate the potential effects of firm insolvencies on households and the wider economy.
We consider shocks from firm insolvencies as the percentage changes in final demand, which is approximated by the ratio between the number of employees of insolvent firms and the total number of jobs of each region-industry cell.
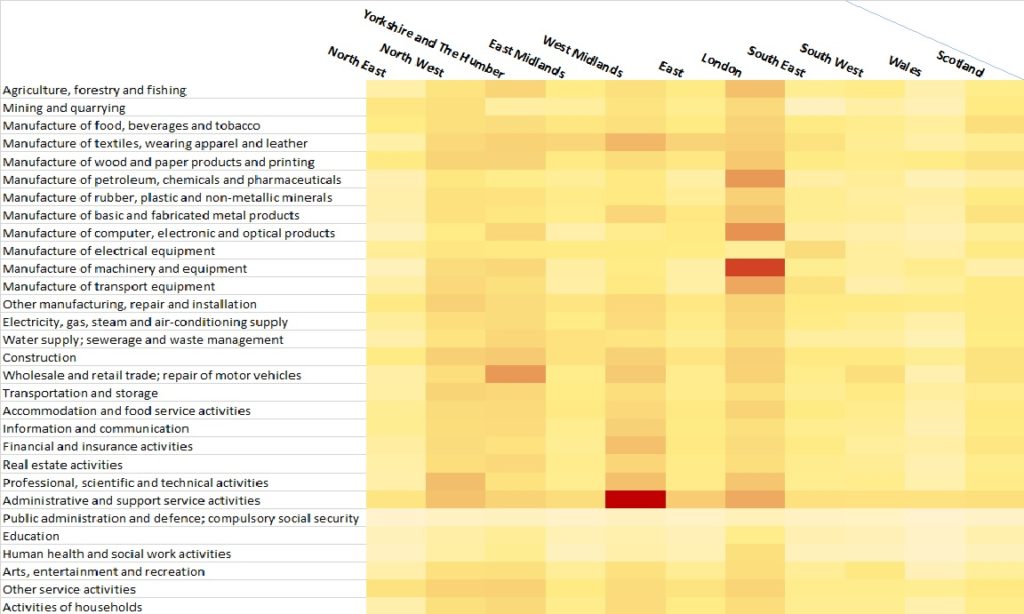
The heatmap shown in figure 3 presents the simulated knock-on effects of insolvencies (resulting from changes in final demand) on Gross value added (GVA, as percentages) across regions and sectors with darker colours indicating greater shocks.
Regional Impact
The modelled rise in insolvencies has the greatest gross impact in London. The second tier of impacted regions includes West Midlands, North West, Yorkshire and The Humber and West Midlands and the third tier of all remaining regions. The heatmap shows the gross impact and therefore it is unsurprising that London and regions with more enterprises have experienced a greater overall impact on GVA.
Sectoral Impact
Our analysis of the impact of insolvencies on industry sectors also provides some interesting insights. Despite manufacturing sectors seeing the highest rise in insolvencies, we find that in the West Midlands, which is known as a strong manufacturing region, the most affected sector is administrative and support service activities with a 10.9% decrease in GVA.
Figure 3: GVA impact heatmap
Knock-on effects on households
The extended SEIM-UK model also provides an important overview of how current economic shocks could affect future household income and consumption for three distinct income groups.
The maps in Figure 4 show the simulated impact on household consumption and we can see that the effect on regions differs significantly by income group. The low-income group in the West Midlands and Yorkshire and Humber are most affected, with an average reduction in consumption of over 1.5%. Contrasting this, the simulated impacts on other income groups are similar across regions and lower.
Figure 4: Simulated effects on household consumption
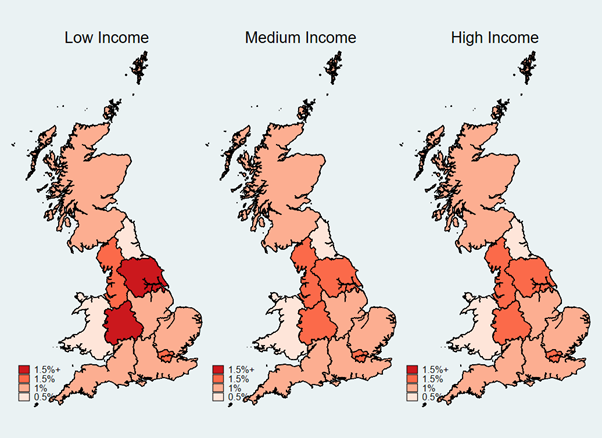
Low-income refers to households with income less than £25,000 per annum (2016 real term adjusted for household composition), medium income group refers to households with £25,000 to £50,000, and high-income group refers to households with income more than £50,000
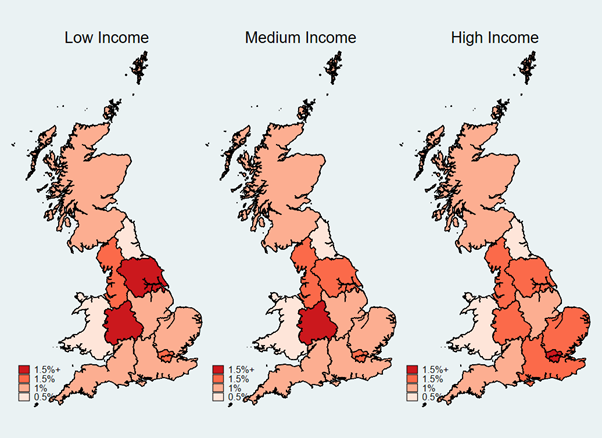
Figure 5 shows the simulated impact of insolvencies on household incomes. Again, the West Midlands is most strongly affected, with low-income and medium-income groups experiencing income loss of more than 1.5%. The low-income group in Yorkshire and Humber is also significantly impacted. Contrasting this, those with high incomes in London and the South are more impacted, compared to other income groups in these regions. This reflects both the higher average income in London and differences in the sectors affected.
Figure 5: Simulated effects on household Income
In summary, a forward-looking simulation of the impacts of firm insolvencies in 2022 indicates a strong economy-wide knock-on effect on GVA, household income and consumption from these insolvencies. In particular, low and medium-income groups are most affected in regions outside London and South. The effect is expected to be strongest in the West Midlands and North West.
Conclusions and Recommendations
Our analysis, based on the logic chain that links firm failure to unemployment and household deprivation, estimates the knock-on effects of the current record levels of firm insolvencies across UK regions. We find a clear transmission effect between company bankruptcies and household incomes and consumption levels, with significant variations by sector, region and income group. Although the SEIM UK model does not provide insights into the time lag between cause and effect, it does provide insights into the places and people that are most likely to be negatively affected.
This presents an opportunity for policy to be more precise in its interventions to support households, using insolvencies as an early indicator. Specific regions and communities, notably lower-income earners in the West Midlands and the North West, should be the target of stronger support measures. Potentially such policy interventions should target firms, following the example of furlough schemes and other mechanisms employed during the Covid pandemic, but taking on board the lessons learnt during this period.
We know from prior research that unemployment, lower household income levels and increased deprivation also create knock-on effects in the form of higher benefits costs, increased homelessness and worsening health outcomes.
Next Steps
The next steps in this programme of research seek to better understand the relationship between economic shocks, firm failure and the full, system-wide costs transmitted via households and onto poorer communities. This is critical as current economic pressures increase the polarisation between wealthier, more resilient regions and communities, and those less well-off, making any attempts at ‘levelling up’ more difficult.
This blog was written by Professor Simon Collinson, Dr Matt Lyons and Dr Huanja Ma, City-REDI, University of Birmingham.
The opinions presented here belong to the author rather than the University of Birmingham.
To sign up for our blog mailing list, please click here.