On 15th March, the government released its Spring Budget. Alice Pugh and Maryna Ramcharan examine the budget's impact on the West Midlands.
The key announcements from the budget and initial analysis can be seen here.
This budget is the first budget since the turmoil of the autumn ‘mini budget’ 2022 and the second autumn budget 2022 from Jeremy Hunt.
The main issues which this budget is hoping to tackle that relate closely to the West Midlands’ economy are:
- The Cost-of-Living Crisis- the Energy Price Guarantee (EPG) has been extended to help households with the cost-of-living crisis. The extension will see the EPG continue at its current cap rate of £2,500 for the average UK household till July 2023. Originally the plan would have been to raise the cap value to £3,000 from April.
- Economic Inactivity and high job vacancies, with low unemployment- There has been rising economic activity since the pandemic. Economic inactivity is largely rising as a result of people retiring earlier than anticipated, plus increases in ill health leading to people leaving the workforce. Additionally, childcare duties have restricted people’s economic activity levels for decades. However, in recent years childcare costs have increased exponentially, which means for some it is costing them more in childcare than going to work. This leads to economically active parents reducing their activity to be able to meet childcare responsibilities.
Energy Price Guarantee
The Energy Price Guarantee (EPG) has been the mechanism through which the government has been supporting households through the energy price crisis. It has essentially placed a cap on the retail price of both gas and electricity, with the government paying the difference between the actual and capped price. This has been an expensive policy costing the government around £24bn so far. However, without the support, household energy bills could have increased to in excess of £7,000 for the average UK household annually.
Last autumn, the cap for the average household energy bill was set at £2,500. The cap was expected to have risen to £3,000 under this budget but the government has instead decided to maintain the £2,500 cap till the end of June. This is forecast to add a further £2.9bn to the cost of this policy, meaning the total cost will come to around £27bn.
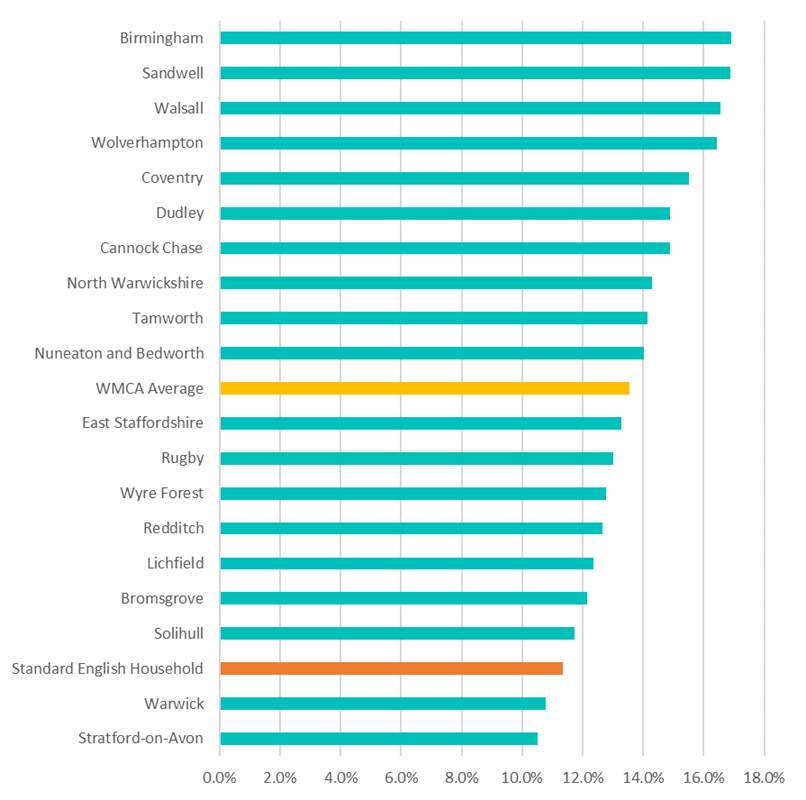
Even with the cap in place, households have seen their energy bills almost double since 2021. Under the current cap, the average household from every local authority within the West Midlands Combined Authority (WMCA) would be considered as being within fuel poverty as they spend more than 10% of their income on their energy bills, as seen in the graph below. Even the average English household will be spending more than 10% of their wages on energy bills. However, without the EPG household energy prices would have increased exponentially and many households may have plummeted into extreme fuel poverty.
Figure 1: Current Annual energy bill under the £2,500 cap as a proportion of Gross Disposable Household Income
From July, energy bills are forecast to fall below the EPG cap and as a result the cap will likely fall back down to levels seen before the invasion of Ukraine. Overall, whilst the support offered in the new financial year (2023-24) will be lower than this financial year (2022-23), the new energy policy will be more progressive than the 2022-23 policies. The Resolution Foundation has estimated 70% of the EPG in the 2023-24 financial year will support the poorest half of the income distribution, compared to the policies enacted in 2022-23 which saw the only 54% go to this income group. This is largely due to the majority of support in the new policy being provided through direct payments to those on benefits, in a much more targeted model.
Households will be relieved that their energy bills will not be rising again in April. Although many will be anxious about what comes in June, will the government remove the cap on energy altogether, or will they reduce it back down to similar cap levels seen in 2021-2020 at around £1,138 for the average household. The likelihood is that dependent on wholesale energy prices, the government will slowly reduce the cap on energy prices on a quarterly basis. However, if energy prices do not continue to fall then the cap could increase to £3,000 in July. The reality is this is a fast-paced changing market over which the government has very little control, with prices beholden to the global wholesale energy market.
Early retirement
Retired people are a major part of those who are economically inactive in all Local Authorities. The percentage of retired people among those who are economically inactive ranges from 69% in Bromsgrove to 35.1% in Birmingham. Although 35.1% of retirees in Birmingham appears less significant being a relative metric, it translates into an absolute value of 138,500 retired people due to the highest total population of economically inactive residents – 395,000 persons – being in Birmingham.
Figure 2: Economically inactive people aged 16 and over, by Local Authority
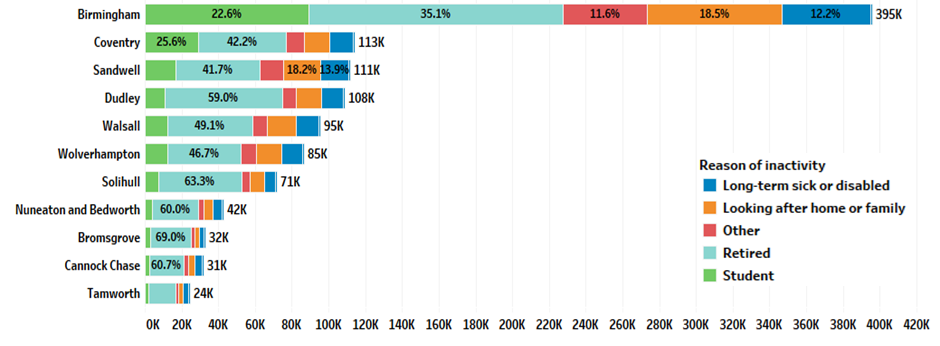
There were 395,000 economically inactive people in Birmingham alone at the time of Census 2021. A significant part of them were retired people – 35.1% (or 139,000 persons) followed by students (22.6%; 89,000 persons) and those looking after home and family (18.5%; 73,000 persons). 113,000 economically inactive people were recorded in Coventry with 48,000 (42.2%) retirees and 29,000 (25.6%) students.
As can be seen from the time series in Figure 3, Tamworth, Nuneaton and Bedworth and Coventry saw the biggest after-pandemic move to economic inactivity among people aged 50-64s. Birmingham didn’t see a spike increase in early retirees after the pandemic. However, given the high total number of people in Birmingham, even a small increase to 27.2% of early retirees amounts to 39,000 people of that age out of the workforce.
Figure 3: Economically inactive people aged 50-64, %

To tackle this group of early retirees the government will introduce skills-boot camps or ‘returnerships’ or ‘mid-life MOTs’, whichever you prefer. Whilst this might work on those claiming universal credit or job seekers allowance, a large proportion of the workforce have left because they can afford not to work anymore. Generous pension schemes and financial stability have offered them more flexibility around when they can leave the workforce. In addition, the pandemic sped up the rate at which experienced staff have left the workforce, largely as people have become disillusioned by their jobs, the UK jobs market has dramatically changed since the financial crash. It is unstable with high workload expectations and for many, the pitfalls of their jobs were brought to the forefront by the pandemic. This group was also most likely to have suffered job loss during the pandemic, for many, this has put them off from returning to work.
Skills boot camps may encourage a proportion of those aged 50 to 65 back into the workforce, possibly those in their early 50s. But those in their late 50s or 60, they have little to gain from returning to the workplace.
Childcare and economic inactivity
One of the main reasons that parents have reduced economic activity is childcare responsibilities. The UK has one of the highest childcare costs in the Organisation for Economic Co-operation and Development (OECD), this restricts parents from being able to afford private childcare, especially when for some low-earning parents, it costs them more to pay for 8 hours of childcare than they would earn working. This leads to many parents being forced to reduce their working hours and potentially claim Univeral Credits (UC) to make up for the difference in lost wages.
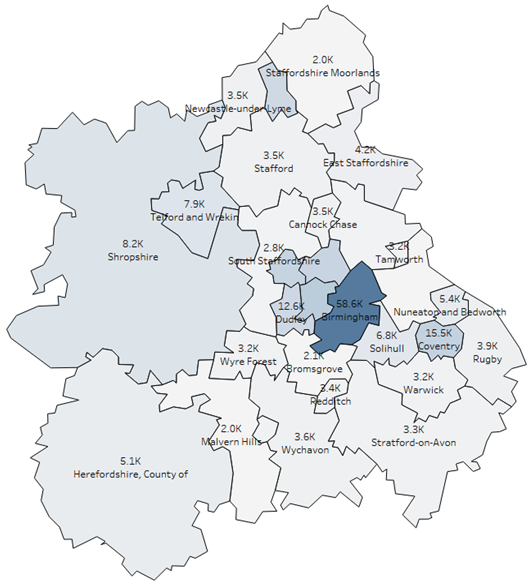
According to Department of Work and Pension (DWP) data – specifically, we use the ‘Children in Universal Credit households’ table – there are 234800 children aged between 1 and 4 who live in Universal Credit households in November 2022 (Figure 4) with 58,600 children residing in Birmingham alone.
Figure 4: Children aged 1 to 4 in Universal Credit households.
Under the new free childcare policy these families will find it easier to find free childcare for 30 hours a week for children aged one to four from April 2024. The government is also increasing funding for wraparound childcare support. This should enable parents to ensure that their children are cared for during the day from 8am to 6pm. In theory, this should then enable parents to work longer hours, which will likely be the case for thousands of parents.
However, there are some questions about this support. Firstly, does the market have enough capacity to cope with the additional volume? Childcare prices have increased in recent years due to a fall in supply from childcare providers. Secondly, many people on universal credit are in low-paid and flexible work, where the hours they are scheduled to work do not fit in the parameters of the historic 9am to 6pm working days.
Also, it has been found by the Resolution Foundation that the group most likely to benefit from the new free 30 hours are middle-income groups, partly because UC claimants already get high levels of support with regard to childcare fees. The Office for Budget Responsibility believe this will bring greater flexibility for working parents, however much of this will still rest on the government’s ability to improve childcare supply, otherwise, prices will remain high and unaffordable for many parents.
This blog was written by Alice Pugh and Maryna Ramcharan, Policy and Data Analysts for City REDI and WM REDI.
Disclaimer:
The views expressed in this analysis post are those of the authors and not necessarily those of City-REDI or the University of Birmingham.