Welcome to REDI-Updates. REDI-Updates aims to get behind the data and translate it into understandable terms. In this edition, WMREDI staff look at the government's flagship policy - Levelling Up. We look at the challenge of implementing, understanding and measuring levelling up.

Emerzon Somera discusses using sustainable development goals as indicators for levelling up, looking at what they are and how to use the data effectively.

 View REDI-Updates.
What are Sustainable Development Goals?
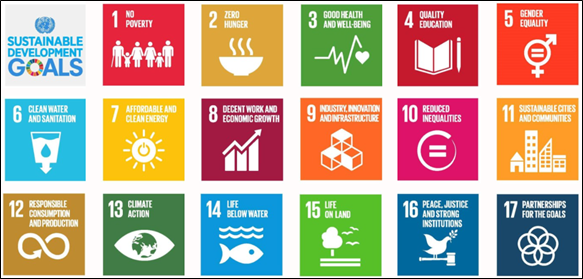
Sustainable Development Goals (SDG) is an agenda which emphasises a holistic approach to achieving sustainable development for all. It was adopted by all members of the United Nations in 2015 as a universal call to action to end poverty, protect the planet and for all people to enjoy peace and prosperity by 2030. There are 17 goals in total, some of which aims to tackle and understand issues such as Good health & Well-being, Affordable and Clean Energy, inequality and education. The West Midlands State of the Region and the City Index draws on the SDG structure to develop the indicators set, looking for the best matches to the SDG in data available at the local level. The SDG approach has been adopted internationally as a shared goal with a vision of improving places across a holistic and interconnected set of thematic areas for policy. SDG goals offer a broader approach to levelling up than is suggested by the white paper but can form the basis of a place-based self-assessment that enables greater benchmarking and potential international comparison.
Utilising SDGs in the WMREDI Data Lab
The Sustainable Development Goals Dashboards are one of the first sets of products that the WMREDI Data Lab has produced and were initially built to be a prototype which brought together the technical work being carried out on indicators.
The SDG dashboards look at thematically grouping indicators which often cut across the various WMREDI’s research projects as well as the indicators/metrics discussed within annually released reports such as the Birmingham Economic Review (BER) or the State of the Region (STOR).
The current iteration of the SDG dashboards hosts over 35 various metrics with each identified metric having a dashboard dedicated to it. These goals are accessible via the WM Data Lab Website.
Dashboard Structure
The dashboard follows almost an identical pattern throughout the SDGs. Clicking on one of the goals will take the user to its appropriate landing page where the following will be listed; the goal name; indicators covered including their sources; and the type of visualisation present within that dashboard.
A standard metric page will contain 6 visualisations and is split into 2 halves to enable a side-by-side geography comparison. The top row primarily focuses on uncovering any trends or patterns for the metric. The middle row focuses primarily on year-on-year changes where it looks at how much X Local Authority has improved/worsened over time. Finally, the bottom row will be a comprehensive statement of the most recent data available for the specified Local Authorities.
SDG dashboards and levelling up
There is potential scope for the WMREDI SDG dashboard to give an insight into certain indicators that can be associated with the levelling up agenda. These indicators can be associated with some of the reoccurring themes of what ‘levelling-up’ should tackle. Some of these include:
- Boosting the Standards of Living
- Improving Public Services and spreading opportunity
- Improving the Economy
Improving standards of living
Standards of living can refer to improving wealth, access to commodities or implementing changes to achieve better health. Goal #3 Good Health and Well-being covers the Healthy Life Expectancy indicator (HLE). HLE is an estimate of how many years a person might live in a ‘healthy’ state. The tool can be used to assess how Birmingham is performing compared to a different local authority and identify any trends or patterns that emerge within the data.
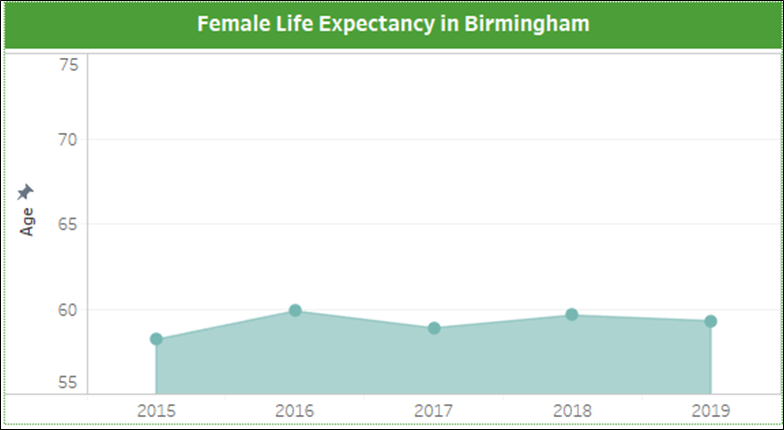
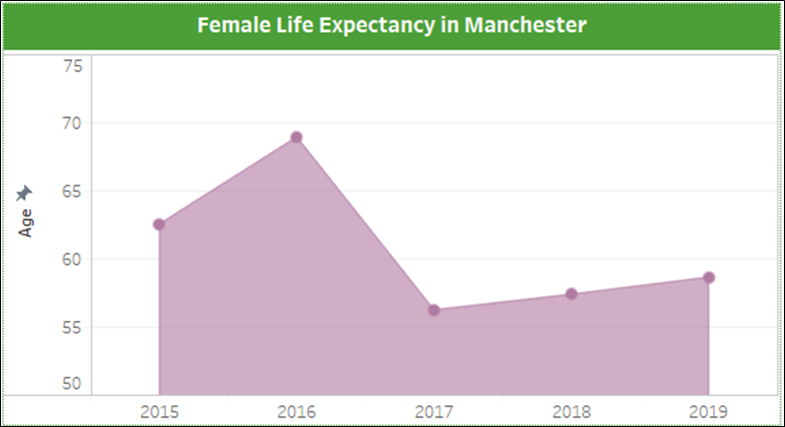
At a glance, the female HLE in Birmingham has consistently stayed the same with the values staying between the age of 58 and 59 for the years 2015 to 2019 whereas female HLE in Manchester covers a bigger range of figures falling between 58 to 68 years. Manchester had seen a significant decrease of over 12 years from the highest between the years 2016 and 2017 but has since steadily been climbing back up.
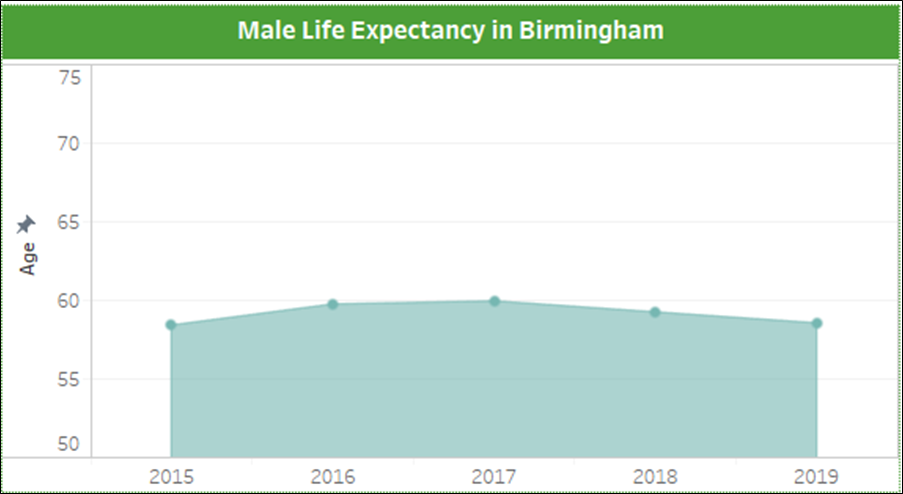
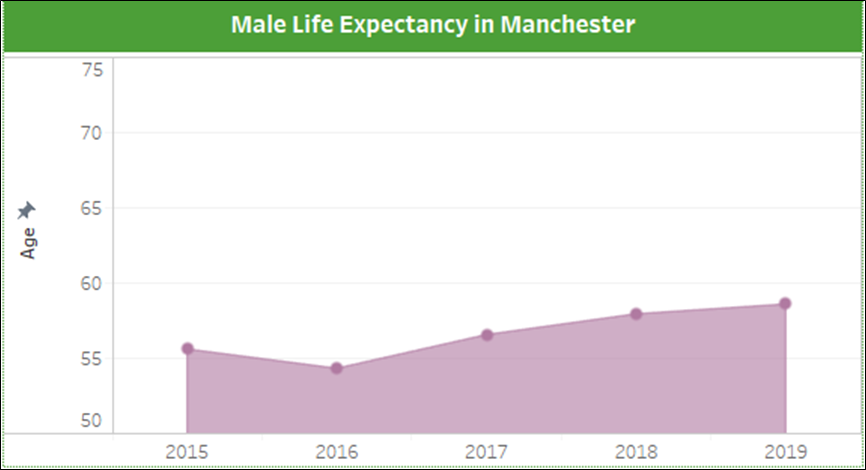
A similar pattern emerges for the male HLE in Birmingham. The figure remained consistent between the ages of 58 and 59 during 2015-2019. Additionally, Manchester’s male HLE figures had also improved and had been experiencing steady growth over the last few years.
Whilst each Local Authority has experienced different changes, both of their figures are still below the UK average of 62.9 years for males and 63.3 for females. Each is moving at a different trajectory and one could interpret that Manchester is doing better in terms of improvement.
Improving Public Services and spreading opportunity
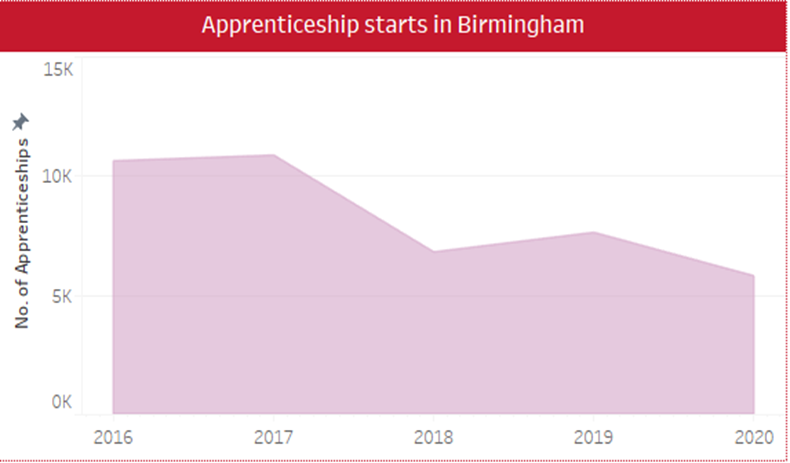
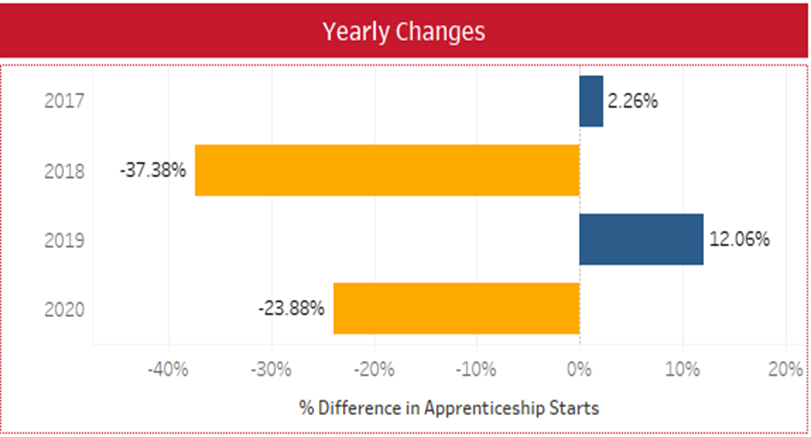
Goal #4 Quality Education’s metrics look at skills, qualification levels and the number of apprenticeships starts. There has been a significant decrease of 23.9% (rounded to 1dp) or 1,820 apprenticeship starts for the 2019/2020 year in Birmingham. This may be due to the adverse effect of Covid-19 where businesses were more reluctant to take on new apprentices thus reducing the pool of apprenticeship opportunities available on the job market.

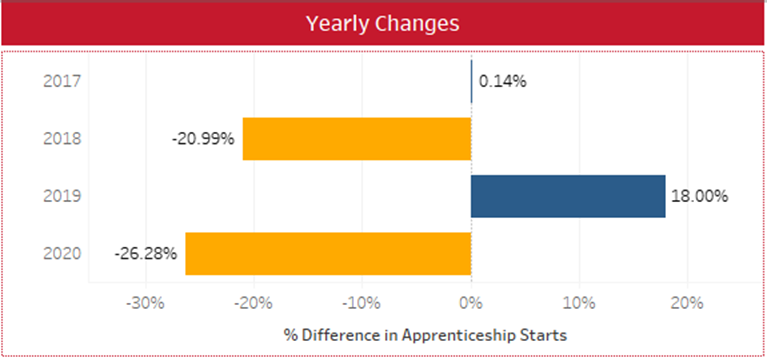
This effect is visible nationwide. For example – compared to Leeds, it’s evident that the yearly changes follow a similar pattern.
Improving the economy
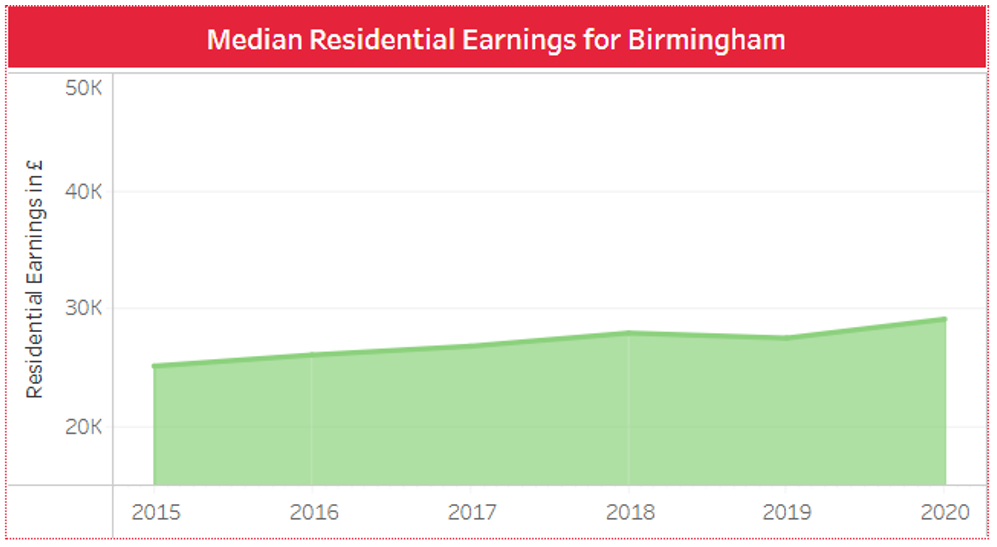
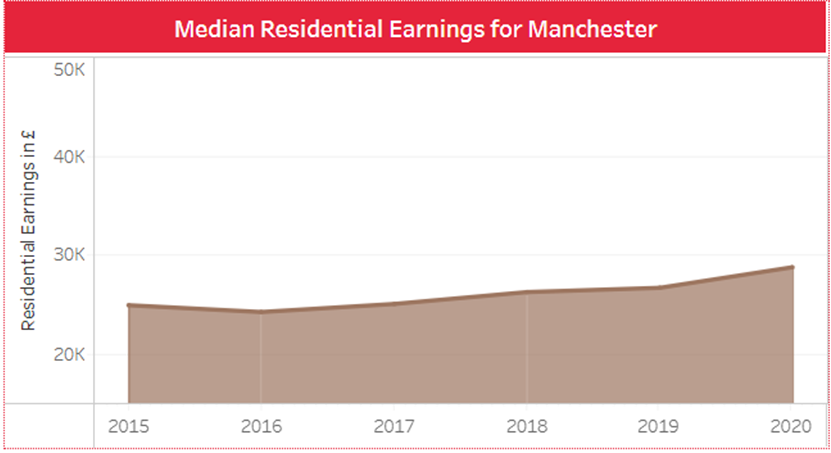
Another recurring theme looking at what to level up is the Economy. Out of the 11 core cities (excluding Belfast), Birmingham had the 5th highest median residential earnings of £29,030. Birmingham also holds the 5th position for most improved with a year-on-year increase of 5.8% for the year 2019/2020. Manchester was below Birmingham at the 7th position in terms of the amount of residential earnings however Manchester was the most improved across the board with a 7.8% earnings increase. With both rankings, Birmingham was placed in the middle of this group.
It is important to note that the SDG dashboards were developed and designed to be a tool used for data exploratory purposes and as an annexe to various reports which simply gives users the ability to explore and examine the data being discussed. The SDG dashboards were not created to explicitly tackle the issues in the Levelling-Up White Paper. However, these dashboards can be used to monitor how a Local Authority is performing against another and against a range of indicators some of which are relevant to levelling up. SDGs cover wider policy areas including some which are notably absent in the LUWP, such as green space, energy, and reduced inequalities and so arguably provide a better holistic approach for place self-assessment.
In the West Midlands we have sued this structure in the annual monitoring of the Combined Authority Area, so regardless of the policy environment, or national strategy focus we understand in detail how our local economy performs. The tool and data can also be used to track and monitor how the metric chosen has changed over time. As the term ‘levelling up’ detail becomes clearer in the future, so should the identification of what metrics to be used when assessing 3 things:
- What to level up?
- Who to level up?
- How levelling up needs to be done?
This blog was written by Emerzon Somera, former City-REDI / WMREDI Data and Policy Analyst, University of Birmingham.
Disclaimer:
The views expressed in this analysis post are those of the authors and not necessarily those of City-REDI, WMREDI or the University of Birmingham.