Welcome to part one in our new series “What is…?” where we explain the language, terms and ideas used in our day-to-day work. Other blogs from the series include:
- What is Transport Resilience?
- What is Smart Specialisation?
- What are Industrial Clusters and Economies of Agglomeration?
Definition and Description
Gross value added (GVA) measures the contribution made to an economy by one individual producer, industry, sector or region. The figure is used in the calculation of gross domestic product (GDP).
GVA is one way of measuring economic output which is used by researchers to measure the contribution made to the economy by individual producers, industries, sectors or regions. The figure is a quantitative assessment of the value of goods and services produced minus the cost of inputs and materials used in the production process. There are three ways of measuring GVA: measuring it by expenditure determines the total final expenditure on goods and services produced in the area; calculating it by income determines the incomes earned by businesses and workers in producing these goods and services; and measuring it by production estimates the value of the goods and services produced minus the value of inputs into their production (such as raw materials and labour costs).

Some issues with the term
As with many measures, there is a lag between when the input data is gathered and the final figure is calculated, meaning that GVA does not show real-time information on the economy. Furthermore, GVA is a measure of economic output that can’t capture improvement and change. Both the EU and the OECD argue that it should not be used in policy-making as an indicator of regional productivity. Comparison over time is also complicated by needing to deflate current prices appropriately.
GVA is drawn from reported company profits and income levels. It is, therefore, a reflection of macro-economic conditions and the effects of regional price differences. Issues such as wage stagnation or companies reporting their profits outside of a region can have a negative impact upon a region’s GVA. A multinational firm made up of layers of subsidiaries may not report its operating profits and employee costs in the same way a small business would, which is a challenge to gathering empirical data. The figure may, therefore, misrepresent the actual economic situation and business productivity “on the ground”. Furthermore, the figure can only pick up activity with a financial return; voluntary activities are not included, for instance. In seeking to calculate a purely financial figure, GVA does not reflect other things of value in individuals’ lives, such as workplace rights and the ability to have a work-life balance.
 Example: Regional GVA Figures
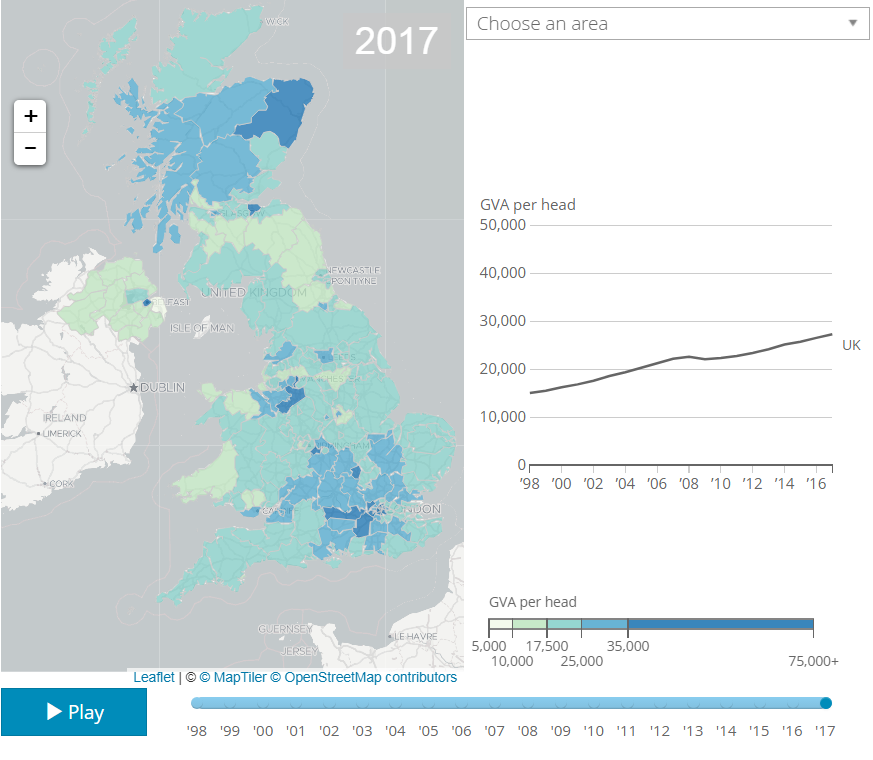
The ONS produces information on regional GVA (see map). This is based on Blue Book national records, HMRC data on PAYE taxation, earnings, employment, finance and regional commuting patterns. The weaker GVA of regions such as the West Midlands relative to London and its hinterland drive policy-makers to launch interventions to boost the regional economy. For example, the West Midlands Combined Authority recently launched its Forum for Growth to coordinate infrastructure (HS2 and intra-regional transport), industry, regeneration, skills, place-making and house-building in order to increase regional economic growth and inward investment.
There are figures available for regional GVA. However, these do not account for inter-regional commuting patterns which can distort the economic output of regions with large numbers of people commuting in and out of the area. It also cannot accommodate different labour market structures in regions, such as shares of people working full- or part-time and regional differences in labour market participation (such as more zero-hours or “gig economy” contracts in certain areas).
What GVA isn’t
- Not a measure of standard of living, as it doesn’t show Gross Disposable Income of the household
- Not a measure of how much is produced because it uses current prices, which change over time and so values need to be deflated
- Can’t compare standards of living between areas, because of different regional patterns in taxes, benefits and price levels
Download a copy
Download a printable copy of What is Gross Value Added (GVA)?
Further reading
Riley, R. et al. (2018) “Measuring Success – review of indicators and recommendations”.
Marais, J. (2006) ‘Regional Gross Value Added’, Economic Trends (627)
ONS, “Gross Value Added (GVA)”
Financial Times, “Lexicon: Definition of GVA”
This blog was written by Liam O’Farrell, Policy and Data Analyst, City-REDI, University of Birmingham.
Disclaimer:
The opinions presented here belong to the author rather than the University of Birmingham.
To sign up for our blog mailing list, please click here.

4 thoughts on “What is Gross Value Added (GVA)?”