
Dr Maryna Ramcharan examines which constituencies will most likely face a homelessness rise in the West Midlands.
This is part of WMREDI’s research into Income Inequality, Policies, and Inclusive Growth.
Effects of Covid-19
A Covid-19 related ban on bailiff-enforced evictions in England ended in May 2021 and has been tapering off since.
As a potential rise in homelessness will add more pressure to already over-stretched housing services, we attempt to foresee how the surge in homelessness will affect all constituencies in the Midlands.
Ongoing pandemic and enforced restrictions significantly changed our normality in 2020. In terms of forecasting, it implies that the main assumption of extrapolating statistical techniques – that existing patterns will continue in the future – has been severely violated and therefore we cannot use historical data alone and must look for a different approach to employ.
We chose to base our predictions heavily on what was known about the likelihood of people to experience housing problems before the pandemic onset and intertwine this knowledge with recent data on how many people were stricken by the crisis and its ripple effects.
The likelihood of a person experiencing housing difficulties may be affected by various factors such as income, household composition, if there are dependent children in the household, tenure type, and others. Regression analysis performed by ONS in 2018 ‘Past experiences of housing difficulties in the UK: 2018’ released on 22 October 2020 allows us to assess the existence and strength of associations between an outcome – in this case having experienced housing difficulties – and an individual’s characteristics and circumstances. The results from this analysis show the differences within sub-groups of the population while controlling for the other factors.
Sources for the analysis
European Union Statistics on Income and Living Conditions (EU-SILC) was another source to feed into scoping of our analysis. The main topics covered by the EU-SILC microdata are income, poverty, material deprivation, housing, labour, education, and health, with indicators at UK national level including housing deprivation, overcrowding and housing cost overburden, among others. Many of these indicators are broken down by age, sex, tenure type, and other useful characteristics which increase our understanding of which groups of the population have more chances to experience housing difficulties.
Given the outcomes of the above-mentioned analysis by ONS and EU-SILC and assuming that it is the income of the household that is influential in kick-starting the accumulation of rent arrears we chose seven contributors which we think will increase chances of homelessness for a person:
- Was the person’s income affected by the pandemic? If so, then such a person will likely have difficulties with paying rent and experience housing cost overburden. This is measured by the number of furlough jobs in each Parliamentary constituency (PC) as a proxy.
- How many members of the household are employed and can therefore contribute to rent expenses? This is measured by the number of mixed households in the area where ‘Mixed household’ is defined as one with at least one person aged 16 and over is in employment and at least one other is either unemployed or inactive.
- Is it a one-person household? Singles are more vulnerable compared to those who cohabitate and share housing expenses.
- Are there dependent children in the household?
- Mixed households with dependent children
- Mixed households without dependent children
- Is a tenant renting privately or is she/he a council tenant? We expect that those renting privately will be more vulnerable to eviction
- What is the median income in the area? We consider low income to be associated with higher chances of a person experiencing housing difficulties. According to the above-mentioned ONS analysis, all factors related to deprivation are significant and those people who are deprived, severely deprived, those with low work intensity and unable to make ends meet, or unable to afford an unexpected cost of £800 and find the total cost of housing a heavy / somewhat heavy burden have 2-3 times more chances to experience housing difficulties.
With contributors decided, we then assembled relevant data about parliamentary constituencies (PCs) in the West Midlands and calculated an overall metric to rank PCs according to their chances of facing a surge of homelessness after the eviction ban will start tapering off. The overall score was derived as an index that measures the propensity of the inhabitants of an area to experience housing difficulties and accumulate rent arrears.

The overall metric was calculated by the formula of a weighted mean:
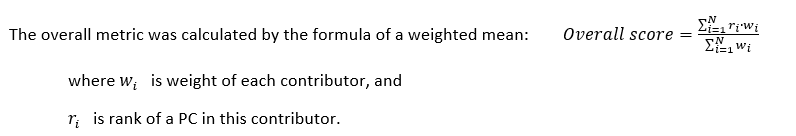
The weights are assigned to contributors based on the findings of EU-SILC (European Union Statistics on Income and Living Conditions) and analysis of past experiences of housing difficulties in the UK from ONS in 2018:
| Contributor | Weight (wi) |
| 1. Cumulative number of furloughed jobs by 14 April 2021 | 0.2 |
| 2. Mixed households with a lone parent | 0.2 |
| 3. Households rented privately | 0.2 |
| 4. One person households | 0.1 |
| 5. Mixed households with dependent children | 0.1 |
| 6. Median income in this Parliamentary Constituency | 0.15 |
| 7. Mixed households without dependent children | 0.05 |
Outcomes
Based on the derived overall score across PCs in the West Midlands, we foresee the greatest rise in homelessness in:
- Coventry North East
- Birmingham Ladywood
- Birmingham Yardley
- Birmingham Erdington
- Birmingham Perry Bar.
Feedback
Following feedback on the evictions toolkit, and trying to breakdown to lower geography levels, struggling people may be masked by the overall constituency containing some wealthier areas, we supplemented the analysis with DWP statistics on people on Universal Credit at postcode district level and accompanied it by geodemographic Mosaic data to describe family types. This analysis suggests that expenses should be taken into account as well as incomes, as in the case of large families with a median income above £25K per annum it is higher expenses that cause them to struggle.
The dashboards and analysis are available here.
This blog was written by Maryna Ramcharan, from the West Midlands Combined Authority.
Disclaimer:
The views expressed in this analysis post are those of the authors and not necessarily those of City-REDI / WMREDI or the University of Birmingham.