Welcome to REDI-Updates - providing expert data insights and clear policy guidance.

In this edition, WMREDI staff look at the government's flagship policy - Levelling Up. We look at the challenge of implementing, understanding and measuring this Levelling Up.

In this blog, Carolin Ioramashvili, Kelvin Humphreys and Simon Collinson examine the promise to boost Government R&D spending outside the greater South-East region.

View REDI-Updates.
In the 2020 edition of our REDI Updates, we examined the government’s promise to increase R&D spending to 2.4 percent of GDP (the OECD average) linked to the need to rebalance growth across UK regions. Since then we have seen the launch of the Government’s Innovation Strategy and the Place-based R&D Strategy and now the Levelling Up White Paper, with R&D as the second mission listed out of 12.
The Government states:
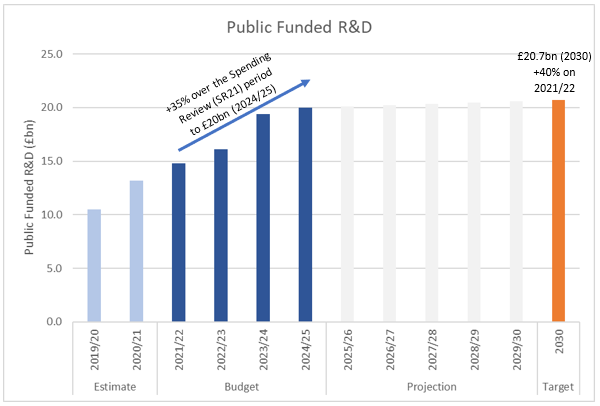
“By 2030, domestic public investment in R&D outside the Greater South East will increase by at least 40%, and over the Spending Review period by at least one third. This additional government funding will seek to leverage at least twice as much private sector investment over the long term to stimulate innovation and productivity growth.”
As part of the adoption of levelling up as a core goal for BEIS and UKRI the government has made the initial commitment to spend 55% of its budget outside the ‘golden triangle’ by 2024-25. This was at least partly triggered by a well-publicised NESTA report by Forth and Jones (2020), which noted that London and the two subregions containing Oxford and Cambridge account for 46% of all public and charitable spending on R&D, but just 31% of business R&D and 21% of the population.
Analysing UK Government R&D spending, past, present, and promised, we find some hope but also disappointment for those in city-regions outside of London, the South-East and East of England (GSE). A reality check provides the following conclusions.
Many see mission 2/12 as promising new funding, but it does not look like a lot
A major reason that the R&D spending numbers are underwhelming is that a significant boost to R&D investment was already announced in the latest Spending Review (SR21). SR21 shows public spending on R&D rising from £14.8bn in 2021 to £20bn in 2024. A 35% (nominal) increase by 2024 was excellent news. Increasing spending by 40% by the end of the decade only adds a further £0.7bn by 2030 (assuming this is a percentage increase over 2021 budgeted levels and in nominal terms, on which the White Paper is not clear), and that’s assuming both the Greater South East (GSE) and non-GSE see a 40% increase. If the GSE sees a lower increase as part of rebalancing efforts, then the overall increase will be less than £0.7bn.
The 40% overall increase and 55% outside the GSE are not enough to achieve levelling up.
The target for a 40% increase in public R&D spending by 2030 only applies to the non-GSE regions (see above). The aim for BEIS to invest at least 55% of its R&D funding outside the GSE East by 2024-25 is a step in the right direction but does not appear to go far enough to rebalance the current spending distribution.
The funding aim includes BEIS spending through UKRI, other BEIS R&D funding competitions, industry R&D programmes and R&D infrastructure. It is difficult to track regional spending of all public R&D funding and the Government acknowledges this. It makes a clear statement in the White Paper (p.172) of its intention to develop better data in the future and close these evidence gaps.
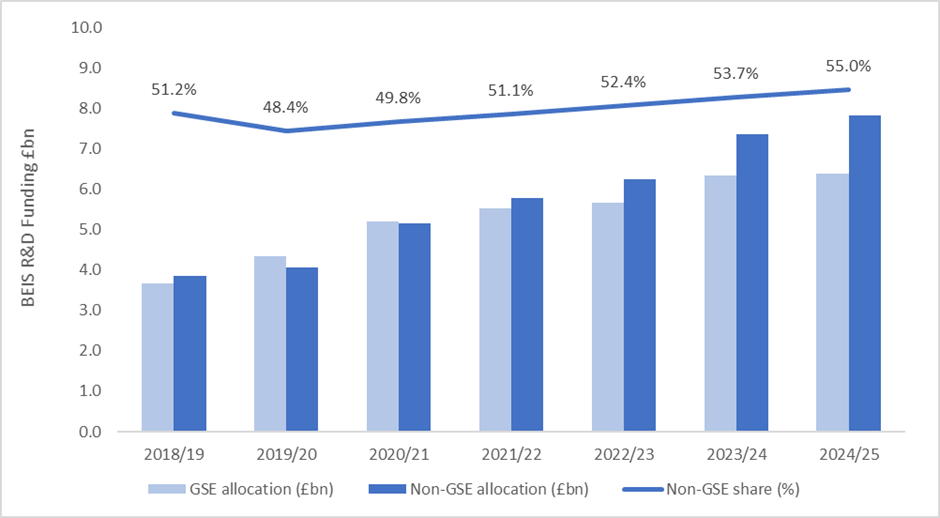
Using currently available UKRI data for Innovate UK, Research Councils and Research England we have traced 67% of BEIS’ R&D spending in 2018 and 51% of spending in 2019 to the main regions of the UK at the International Territorial Level 1 (ITL1) level. The data shows an almost 50:50 split in spending in the GSE and non-GSE when averaged over the two years (In this exercise the GSE is defined as ITL1 regions: London, South East and East of England. The non-GSE includes all remaining regions in England plus Scotland, Wales and Northern Ireland).
An indicative estimate of BEIS regional R&D spend in 2024/25
A shift to a 55:45 split in favour of the non-GSE by 2024/25 is then indicatively a welcome step towards rebalancing. Assuming all BEIS R&D funding follows the same distribution as that identified in the available data, then the targeted distribution would represent a £0.7bn reallocation of budgeted funding in 2024/25 from the GSE to the non-GSE.
However, the GSE as defined in this analysis covers only 37% of the national population and would still be over-weighted on a per capita basis. The GSE would also see substantial growth in R&D funding despite the rebalancing given the large increases in BEIS budgeted spending in the SR21.
Which regions will benefit very much depends on how the uplift is delivered.
If we take the West Midlands, it was highlighted by Jones and Forth (2020) as a region which attracts about £400 per capita in private R&D spend, compared with only £83 in public R&D spend. But the West Midlands has done better in attracting Innovate UK funding, particularly in 2018-19 when it was awarded 14% of the national total, compared to a much lower annual average in other years. Given that there is an anticipated ‘36% real-terms increase for Innovate UK annual core funding between 2021-22 and 2024-25’ (compared to the 35% nominal increase for overall R&D funding), this could be a significant opportunity for this region at least.
The government wants to focus a high proportion of any new funding on translational or ‘applied’ R&D. In fact, one observation is that only £5.9bn of the £20 billion promised across the government by 2024-25, will be spent on the “core research budget.”
Research councils and Formula based, Quality-Related (QR) funding is unlikely to increase as much as other BEIS and government spending on R&D. But this raises another opportunity for the West Midlands, alongside Greater Manchester and Glasgow, who have been earmarked for £100 million for Innovation Accelerators in the Levelling Up White Paper. These are likely to be intermediary technology transfer facilities, linking universities and other R&D sources to local firm-level demand. As in the case of the Warwick Manufacturing Group (WMG), Tyseley Energy Park (TEP), or the Manufacturing Technology Centre (MTC), these might also be funded to combine technology development, upskilling, entrepreneurship, scaling-up and support for small firms and local supply chains. These centres are all in the West Midlands and subject to a WMREDI study of ‘STEM assets’ to evaluate their local impacts.
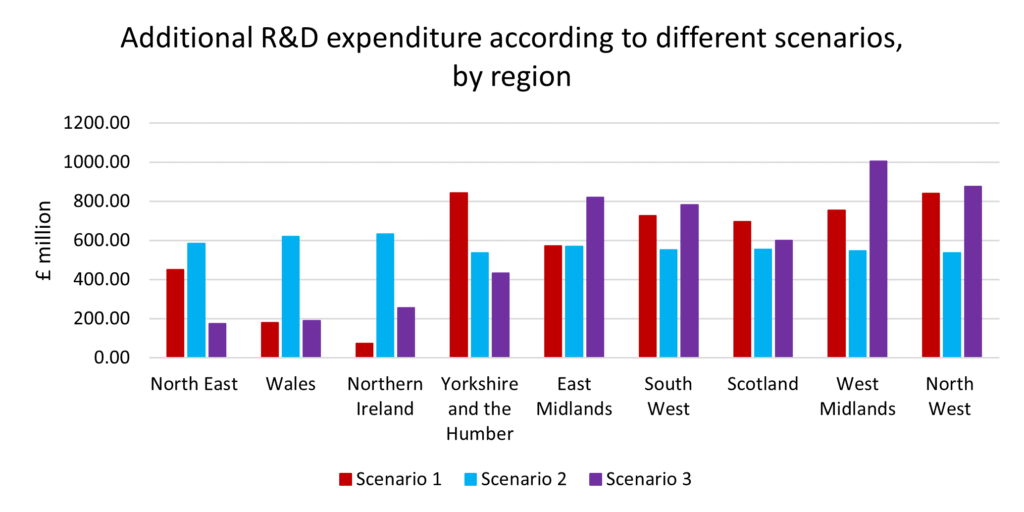
Based on the latest available data on UKRI and further BEIS expenditure on R&D, as well as ONS data on university and private sector expenditure, we have developed several scenarios on what the 40% promised increase in spending outside the GSE could mean for different regions. The modelling also takes into account the target to double match additional public funding with private sector sources. The modelling assumes that this target will be met, although this may be more challenging in regions with a weaker private innovation sector.
The figure below shows the pound increase in overall R&D expenditure over the policy period, according to three plausible scenarios. Scenario 1 assumes that there will be an overall 40% in government funding, which will be distributed in the regions outside the GSE following the previous distribution of government funds. In this scenario, the North West and Yorkshire and the Humber would be big winners, as well as the West Midlands.
Scenario 2 assumes a larger effort to rebalance expenditure across all regions. In this scenario, more of the additional funding is allocated to regions that previously received less public funding. The distribution of funds is relatively even, with most additional funds received in the North East, Wales, and Northern Ireland, although it is as yet unclear how the policy would apply in the devolved administrations.
Lastly, scenario 3 assumes that the government follows market signals in allocating funds and assumes that additional funding is distributed proportionally to private sector R&D expenditure. This scenario would be plausible, also with the double-matched private sector leverage target in mind. Here, the West Midlands would be the big winner, gaining more than £1 billion in additional funding by 2030, followed by the North West and East Midlands.
Will all of this be enough to outweigh the losses from EU funding?
This is an important but complex calculation. By some estimates, UK regions (except Cornwall) are anticipating a 54% drop in funding as ERDF and other EU structural funds end and new programmes, such as the Shared Prosperity Fund, start. This is over the current spending review period and after adjusting for inflation the real terms impact may be higher. One estimate suggests that this amounts to a decrease of £69 million a year for the West Midlands.
In counter, a 35% increase in R&D spending performed by the public sector in the West Midlands (using 2019 as a base) would be worth about £191m a year by 2024/25. This would be more than sufficient to cover the gap left by EU funding (net of SPF) by the middle of the decade.
But we need to remember that EU structural funds in the past, and the new Shared Prosperity Funds, are for a wider range of applications than simply R&D-focused investment. A fuller analysis is needed to estimate the net losses or gains for different regions that would be triggered if the policies in the Levelling Up White Paper were delivered.
This blog was written by Carolin Ioramashvili, Kelvin Humphreys and Simon Collinson, City-REDI / WMREDI, University of Birmingham.
Disclaimer:
The views expressed in this analysis post are those of the authors and not necessarily those of City-REDI, WMREDI or the University of Birmingham.