Dr Carolin Ioramashvili and Professor Simon Collinson compare levels of innovation in regions around Europe with the West Midlands to show policymakers where they can focus investment and interventions.

This is part of a series of blogs looking at Innovation in the West Midlands.

Find out more about our work on regional innovation systems.
Innovation is intended to be one of the key drivers of the Government’s Levelling Up agenda, with increasing innovation funding outside London and the South East one of the 12 missions. But how do UK regions actually perform in terms of innovativeness against their European peers? And where should policymakers focus investment and interventions to improve our regional systems of innovation?
In this blog, we develop indices of innovation “inputs” – such as basic research and development of new technologies, and innovation “outputs” – the commercialisation of these inputs in the form of new or improved processes, products or services. We show that – across almost all regions – the UK is performing relatively well in terms of innovation inputs. But it is lagging behind in terms of applying these commercially – and arguably, it is commercialisation that can drive long-term growth in employment, productivity and prosperity. This is also the area where the South East, as well as the East of England, are performing much better than the other regions.
However, the UK is not alone with this problem. In our analysis of 237 European regions, we find that many regions in Germany and the North of Italy face a similar dilemma, despite being successful engineering and manufacturing hotspots. Other countries, including Norway and France, have the opposite problem, of being good at commercialising new technologies, but having a weak basic research sector underpinning these industries. In fact, there are very few countries that perform well both in terms of innovation inputs and outputs. The exceptions are Belgium and the Netherlands. These countries appear to have a better balance between the supply-side of innovation inputs, and the demand-side of outputs and adoption. If UK policymakers want to learn from other countries how to successfully translate basic science into economic growth, this is where to look.
Measuring innovation inputs and outputs
To develop our indices, we combine several variables into an innovation input and output index. All data is provided by the OECD at the NUTS2 or 3 levels, to be on a similar scale to the West Midlands region. We include the EU, Switzerland, Norway, and the UK. The different variables are combined into indices using Principle Components Analysis (PCA). The baseline indices are based on values for 2015, with gaps filled in with available data from 2012 to 2018.
The input index includes variables that represent basic research and inputs in the innovation process, such as skills, participation in training, public R&D expenditure and patenting in different technologies, which represents the development of these technologies, but says nothing about their commercialisation. The share of PCT patents that are filed jointly with regional partners represents the density of the innovation system.
In contrast, the output index includes variables that represent the translation of basic research into new products, processes and services. This includes the start-up rate, or “births” of businesses, young businesses, defined as three years old, and the ratio of the two, to capture start-up survival. Here, we also include R&D expenditure by the private sector, which is likely to be more applied and translational than publicly financed research. Further, we include employment in high-technology manufacturing and knowledge-intensive services, as well as the overall diversification of the economy, defined by the Hirschman-Herfindahl index of regional GVA (the HH-index is defined by the sum of squared industry shares in total regional GVA).
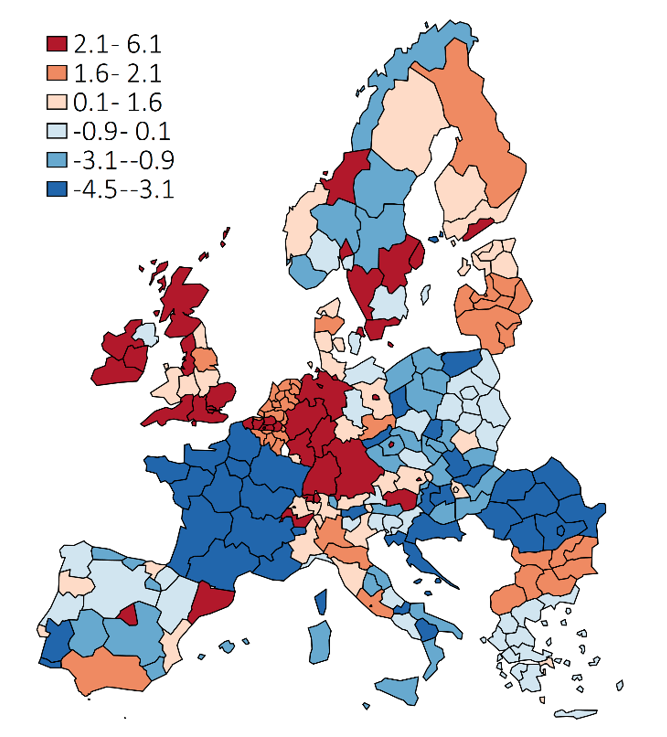
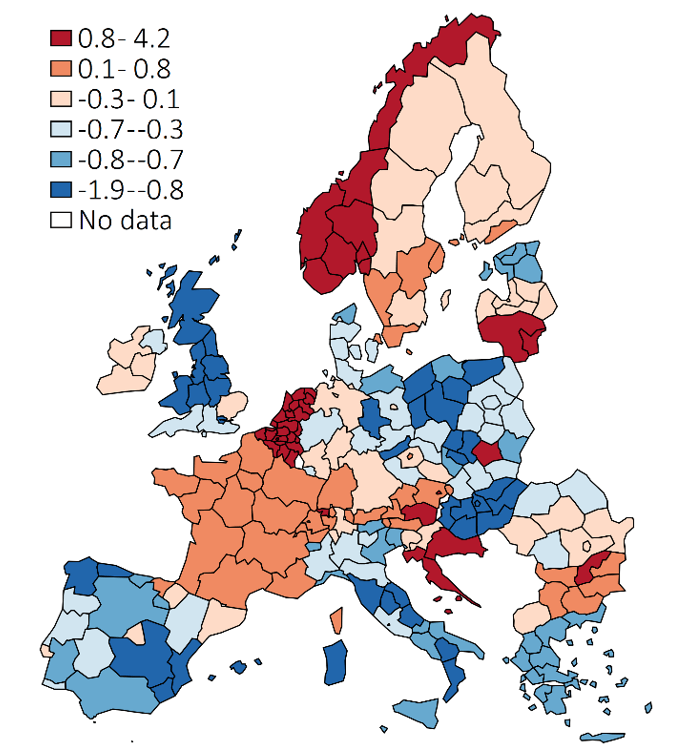
The figures below show maps of the indices. Broadly speaking, regions with a value above zero score above average on the score and are shaded from yellow to red, while regions scoring at or below average are shaded in blue.
Most of the regions of the UK perform very well in terms of innovation inputs, but less well in terms of outputs. This is similar to Germany and the North of Italy. The opposite is true of Norway, and to a lesser extent France, which score low on innovation inputs but high on outputs. Belgium and the Netherlands, and perhaps surprisingly, Bulgaria, score high on both measures.
How does the West Midlands compare?
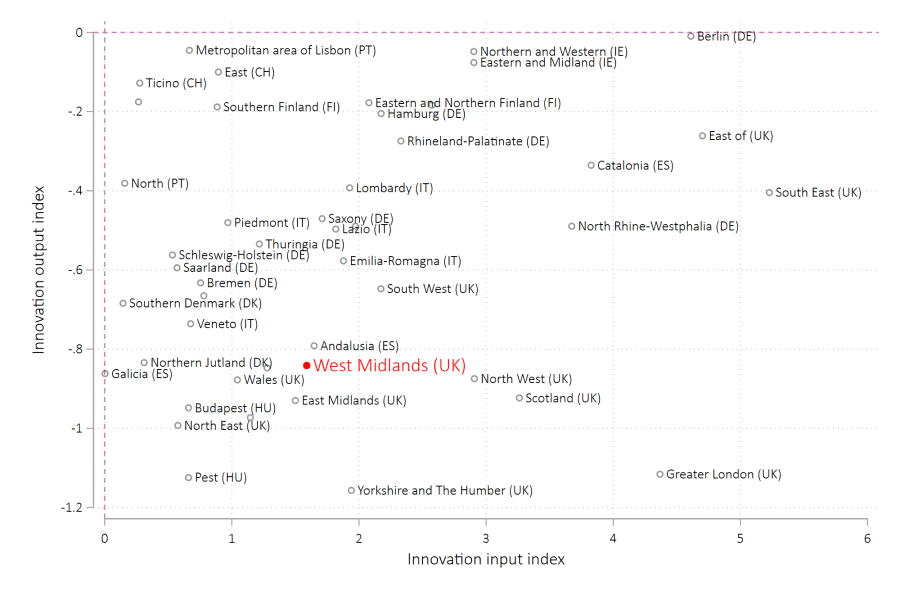
Figure 3 below focuses on a few selected regions that score similar to the West Midlands on both measures. This includes all regions with a positive innovation input index, but a negative innovation output index. The West Midlands, in the bottom left corner of the figure, is highlighted in red. In its immediate vicinity are several other UK regions, including Wales, the East Midlands, and the North East. All other UK regions can be found in this graph as well, with London, the South East and East of England showing some of the highest input scores. The other regions similar to the West Midlands are very diverse and include two Southern European regions with Tuscany and Andalusia, the Budapest, and Northern Jutland, a rural region in Denmark. The other regions on the graph are from Finland, Germany, Ireland, Portugal, Sweden and Switzerland, as well as further regions from Denmark, Hungary, Italy and Spain.
While it may not be immediately attainable for the West Midlands and other UK regions to achieve the same high levels of innovation inputs and outputs as Dutch and Belgian regions, the figure provides some regions that UK policymakers could try to emulate. This includes the Republic of Ireland, where both NUTS2 regions score a little bit higher both in terms of inputs and outputs than the West Midlands, or Lisbon, the East of Switzerland and Southern Finland, which score even a little bit lower on innovation inputs, but much higher in terms of outputs, suggesting a much better rate of translation of inventions into commercial outputs.
This blog was written by Dr Carolin Ioramashvili and Professor Simon Collinson with input from Kelvin Humphreys, Hannes Read & Dr Fengjie Pan, City-REDI / WMREDI, University of Birmingham.
Disclaimer:
The views expressed in this analysis post are those of the authors and not necessarily those of City-REDI / WMREDI or the University of Birmingham.