
Dr Annum Rafique examines the application of marginal abatement cost curves (MACC) to assess low-carbon/net-zero policies and interventions.
-
Introduction
Household energy consumption accounts for a substantial portion of global greenhouse gas (GHG) emissions. As countries aim to meet emission reduction targets, decarbonising the residential heating sector is key. Marginal Abatement Cost Curves (MACC) have emerged as a valuable methodology for evaluating and comparing the economic costs and emission reduction potential of various climate mitigation measures and policies.
MACC plot the cost-effectiveness of mitigation options by ordering them from least to greatest cost per ton of CO2 abated on the y-axis while showing total emission reductions achievable on the x-axis. By plotting the marginal cost of abating each additional unit of emissions against the quantity of emissions reduced, MACC analysis allows policymakers to identify the point at which emissions reductions become too costly and prioritise technologies that offer the greatest emission reductions at the lowest cost (González-Mahecha et al., 2019).
This blog examines the use of MACCs as tools for evaluating low-carbon/net-zero interventions and policies. We discuss different types of MACCs, their advantages and limitations and use the study conducted by Rafique and Williams (2021) on the costs and emission reduction potential of various low-carbon heating technologies for homes in Gwynedd, Wales, as an example to emphasise the usefulness of MACCS in policymaking.
-
Type of MACCs
MACCs can be either expert-based or model-derived curves. Expert-based MACCs evaluate the cost and potential for carbon reduction of a specific abatement measure based on a detailed study. Since expert-based MACCs are built upon the carbon mitigation potential from a single technology, they are also sometimes called technology cost curves (Ekins, Kesicki and Smith, 2011; Kesicki, 2010).
As seen in Figure 1, the expert-based MACC graphically depicts a set of abetment projects/interventions ranked from the least to the most cost-effective choice per kg of CO2 abatement. On the vertical axis is the marginal cost per kg of abated CO2, and on the horizontal axis is the potential CO2 saving in kg per year.
Figure 1: An example of an expert-based MACC.
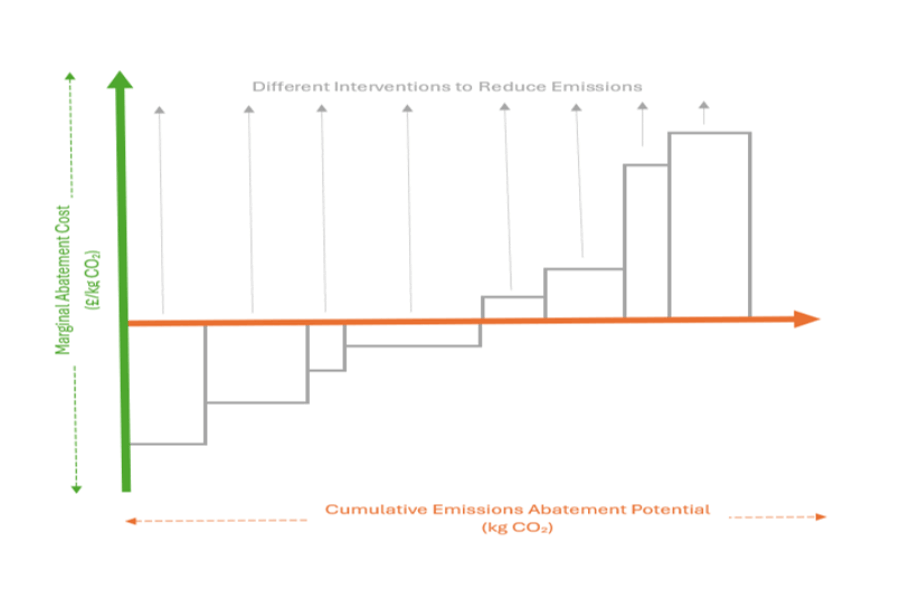
Source: Figure 1 reproduced from Plessis (2022)
The model-derived MACC is based on the calculation of energy models. The abatement curves are generated by summarising the emissions from different CO2 prices or by summarising the CO2 pricing from different emissions limits (Kesicki, 2010).
Figure 2 presents an example of a model-derived MACC.
Figure 2: An example of a model-derived MACC.
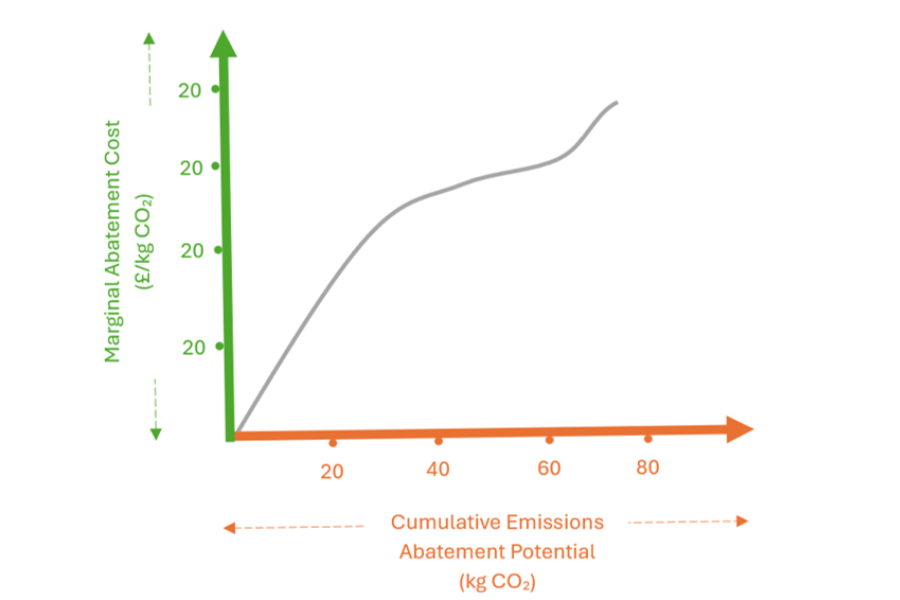
Source: Figure 2 reproduced from Kesicki (2010)
Both approaches have certain merits and limitations. The model-derived curves focus on absolute emissions, so the graphical representation does not show individual technologies. This was one of the reasons why model-derived MACC were not used in this study, as one of the aims is to make it easier for policymakers and households to make an informed decision. A visual representation through the expert-based MACC would make it possible. Thus, MACCs have become popular due to their visual representation, making it easy to see which mitigation measures can significantly reduce CO2 emissions (Kesicki, 2010).
-
Advantages of MACC
Strategic Decision-Making: By identifying the most economical ways to reduce emissions, MACCs give policymakers the information they need to make well-informed decisions. This strategic decision-making guarantees that efforts with limited funding are distributed to achieve the greatest possible environmental advantages.
Technology Prioritisation: MACCs help to prioritise expenditures in research and development by assessing the cost-effectiveness of different technologies. This ensures that technical advancements align with the main objective of cutting emissions at the lowest possible cost.
Economic Efficiency: MACCs direct expenditures toward policies with lower abatement costs, which promotes economic efficiency. This efficiency is essential to meet carbon reduction objectives without putting undue financial strain on consumers and businesses.
Policy Design and Evaluation: Policymakers can use MACCs to design policies that balance economic and environmental objectives. Additionally, continuing evaluation of policies using MACCs allows for adaptive decision-making and revisions depending on real-world outcomes.
Stakeholder Engagement: MACCs provide open lines of communication with interested parties and clarify the financial effects of different emission reduction strategies. Collaboration and support for sustainable efforts are encouraged by this transparency.
-
Challenges and limitations of MACC
Determining baselines: Establishing a baseline scenario is important to construct a MACC. It is difficult to build an accurate baseline scenario due to market imperfection, market barriers, irrational behaviour of agents and incomplete information (Linares, Pintos and Würzburg, 2017).
Overestimation of savings: MACCs, such as the expert-based ones, do not consider the interaction of various energy-saving technologies as a unit of energy that can only be saved once. The overlapping of technologies has the potential to overestimate the energy savings.
-
Example of using MACC: Analysing Gwynedd’s Residential Abatement Potential
MACC was used in this research to analyse the emission reduction potential and cost-effectiveness of low-carbon heating technologies using carbon-intensive fuels for over 54,000 Gwynedd households. It calculated the potential adoption and abatement through 2050 using MACC.
Gwynedd provides an interesting case study given its rural nature, lower housing density, and greater dependence on heating oil, LPG, electricity and coal compared to the UK overall. Data on household energy consumption by fuel type and size was derived from Energy Performance Certificates.
Scenarios Show Pathways to Increased Uptake & Reductions
The research considers three alternative scenarios to model the impact of changes in technology cost, energy pricing, grid electricity emissions and adoption rates on abatement potential.
Under a business-as-usual baseline scenario (as shown in Figure 3), Gwynedd’s space/water heating emissions may decline from 0.302 Mt CO2 in 2018 to 0.189 Mt CO2 in 2048 due to some voluntary adoption of low-carbon systems. Cumulative abatement reaches 3.494 Mt CO2 over 30 years.
Figure 3: Baseline Scenario.
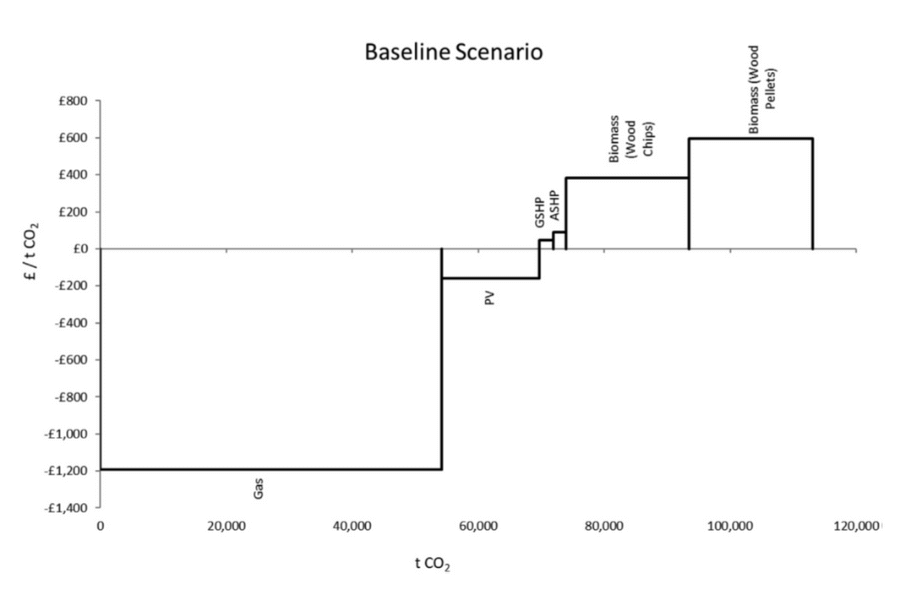
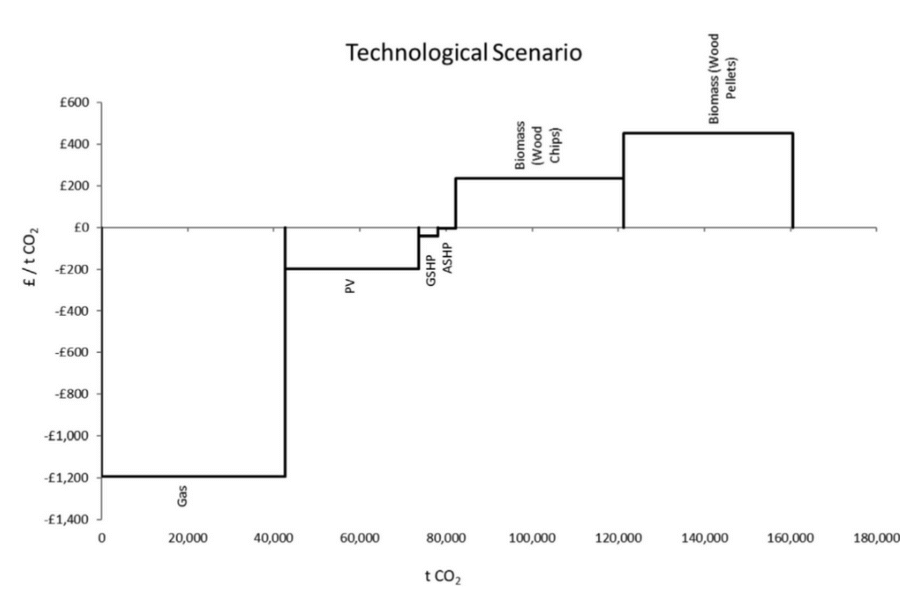
Figure 4 presents the technological scenario in which 20% lower technology costs and doubled adoption rates led to emission savings within reach of 0.16 Mt CO2 annually by 2048, nearly double the baseline. Heat pumps become cost-competitive with gas, and solar PV abatement increases substantially.
Figure 4: Technological Scenario.
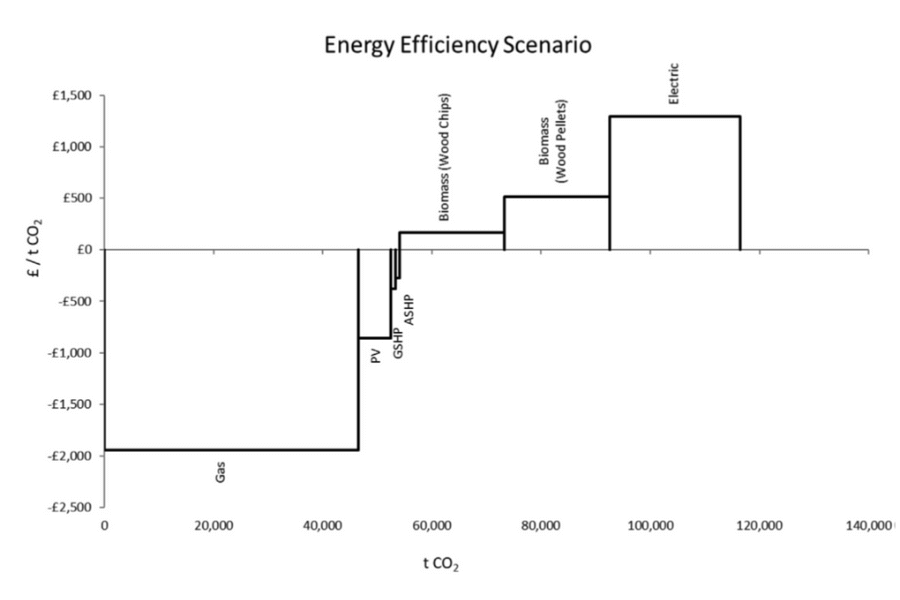
As presented in Figure 5, an energy efficiency scenario exploring rising energy prices and declining grid emissions also boosts cost-effective abatement through increased renewable technology adoption. Total emission reductions grow to 0.116 Mt CO2 per year.
Figure 5: Energy Efficiency Scenario
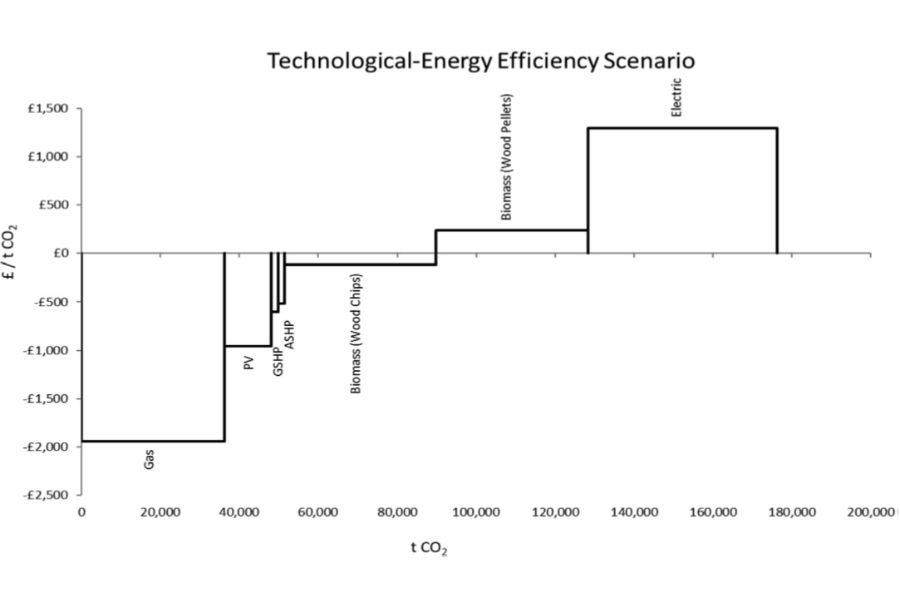
As presented in Figure 6, a combined scenario (technological-energy efficiency scenario) yields the largest impact, cutting annual emissions by 0.176 Mt CO2 in 2048 as all options, excluding wood pellet biomass boilers, become cost-effective.
Figure 6: Technological-Energy Efficiency Scenario
Results
Using MACC, the research finds solar PV the most cost-effective option under all scenarios, offering emissions savings of 0.015 Mt CO2 yearly in the baseline at negative abatement costs. This means PV installation costs are outweighed by bill savings over the system’s lifetime.
Heat pumps also emerge favourably in later scenarios that assume rising energy prices and declining technology costs. However, under baseline assumptions, the substantial upfront investment required along with inexpensive gas heating render heat pumps far less cost-competitive per ton of CO2 mitigated.
Biomass boilers offer significant potential emission reductions but remain expensive even with falling biomass fuel and technology costs. Savings vary substantially based on the type of biomass utilised. Gas boiler installation also scores well in displacing oil, LPG and coal systems. With efforts underway to decarbonise gas supplies through renewable gases, this option may offer increasing emission benefits over time.
Takeaways for Policymakers
The analysis provides several key insights for Welsh policymakers:
- Solar PV should likely be prioritised, given high returns and abatement potential.
- Supporting heat pump cost declines and adoption will be critical to displacing high market share fuels like gas.
- Biomass boilers require further incentives and cost reductions to become economically viable.
- Decarbonising the gas grid via renewable gases can offer additional emission savings.
- Targeted policy combinations around energy pricing, technology deployment and costs can drive higher uptake and reductions.
-
Conclusion
As countries and cities establish mid-century climate neutrality objectives, analyses of this nature will grow increasingly vital to pinpoint high-impact interventions. While Gwynedd’s characteristics differ from other regions, the methodology demonstrates an evidence-based approach to guiding strategic emission reductions in the residential sector.
Comparing the technology’s placement on the MACC curves allows an assessment of their relative costs and carbon abatement across various scenarios. The example demonstrates how MACCs can provide policymakers with vital insight into the trade-offs and returns on investment for climate-oriented interventions in the built environment and energy sectors.
This blog was written by Annum Rafique, Research Fellow City-REDI / WMREDI, University of Birmingham.
Disclaimer:
The views expressed in this analysis post are those of the authors and not necessarily those of City-REDI / WMREDI or the University of Birmingham.