 Local government funding has been under severe pressure since the 2008 crisis. This has stress-tested the local authority finances and capacities to identify efficiency savings leading to severe warnings such as Barnet Council’s graph of doom. In this blog, I am bringing together official figures of the drop in local authority funding in order to show the size of the problem and the challenge for local government with a focus on the soon to be elected WMCA mayor.
The National Audit Office (2014) estimates a 37% decrease in funding from 2010-11 to 2015-16. The decrease is smaller once the council tax income is considered but is still 25%. It is worth mentioning that this decrease does not include the loss from year to year increases in local authority financing in the years before 2010. These drops translate in £10bn savings in the three years from 2011/12 and another £10bn for the two years after (Local Government Association, 2014).
The councils expected to suffer most from these cuts are the ones who are heavily dependent on central government funding. The National Audit Office (2014) calculates that the share of central funding to the local authorities revenues ranges from approximately 30% to 82%. Our calculations show that for the WMCA this figure is just over 73% which means that the local authorities in the area have to face significant funding constraints.
Council tax increases have been unable to cover this gap in funding, partly due to its size and partly due to the constraints in raising council tax. The tax freeze grant offered by central government has been taken up by all local authorities in 2011-12 but this rate has fallen to 66% by 2014-15. In addition, the requirement for a local referendum if an increase of more than 2% in the council tax is proposed has significantly constraint the capacity of local authorities to raise tax through council taxes. Liverpool city council for example estimated the cost of a local referendum at £400,000 (National Audit Office, 2014).
As a result, local authorities have turned to alternative solutions in order to fulfil their statutory obligation of balanced budgets. These include reductions in staff (with the Birmingham city council reducing its full-time equivalent jobs from 21,000 in 2010 to 7,000 by 2018 and 16.6% reduction among all local authorities) and/or reduction of services provided to the statutory minimums (started with planning and development but continued to adult and social care services) and the commercialisation of activities since efficiency gains appear to be drying up. Even after these cuts, numerous authorities appear to struggle to maintain the minimum level of statutory services whilst at the same time, a large proportion of them attempts to increase their reserves due to uncertainty and in order to smoothen out future cuts to funding (Local Government Association, 2014; National Audit Office, 2014).
The situation is not very bright when we consider the Local Government Association’s (2015) projections for the future. These projections show that with the funding gap at 0 in 2014-15, there is an expected £9.5bn shortfall between income and expenditure for local authorities by 2019-20.
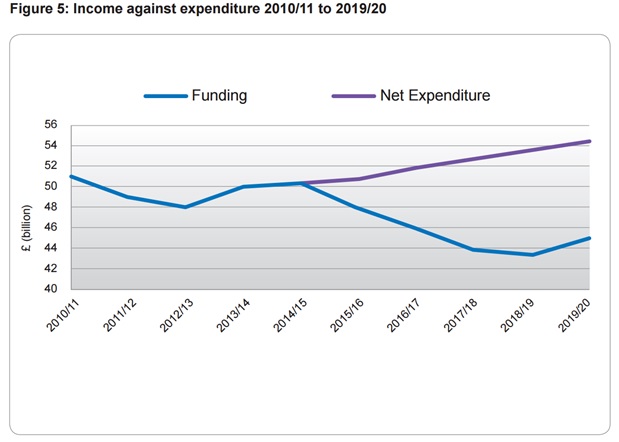
(Local Government Association, 2015) – Model projections
Considering that waste collection and social care statutory services will continue to require an ever increasing share of the councils’ revenues, money for other services are expected to be reduced by 35% in nominal terms from £26.6bn in 2010-11 to £17.2bn in 2019-20. A drop that is more than the £7.7bn expenditure on central services, ‘other’ services and capital financing combined for 2014-15.
According to our own calculations the decrease for WMCA in nominal terms only from 2012-13 to 2015-16 is approximately 9%. This does not take into account inflation of prices as well as increasing funding needs for services.
All in all and in short, funding is reduced and does not seem to be coming back. My expectation is that if local authorities want to continue to provide statutory services and up to a standard they will need a combination of efficiency savings and devolution of powers to be able to apply new local taxes. The soon to be elected mayors will need to champion these efforts and identify new sources of income for their authorities.
Follow City-REDI on twitter
Follow Tasos on twitter and linkedin
References
Local Government Association (2014) Under pressure: How Councils are planning for future cuts. London. Available.
Local Government Association (2015) Future funding outlook for councils 2019/20: Interim 2015 update. London: Local Government Association. Available.
National Audit Office (2014) The impact of funding reductions on local authorities. London: National Audit Office. Available.
4 thoughts on “Local Authority funding in the UK – More ‘graphs of doom’ ahead?”