The latest edition of REDI-Updates is out now - providing expert data insights and clear policy guidance.

In this edition, the WMREDI team investigates what factors are contributing to the cost-of-living crisis and the impact it is having on households, businesses, public services and the third sector. We also look at how the crisis in the UK compares internationally.

Inflation is rising at its fastest rate in more than 40 years.
Alice Pugh discusses what is driving the rapid increase in rising prices.

View REDI-Updates.
What is inflation?
Consumer Price inflation (CPI) is often the inflation rate which you will see being referred to by economists or journalists. CPI is the speed at which prices of goods and services bought by households rise or fall (ONS, 2017). CPI inflation is estimated by using the consumer price indices. The best way to describe the consumer price indices is by imagining it as a shopping basket containing all the goods and services bought by households. To calculate the inflation rate on these goods and services, each month the prices of these goods and services are compared to the prices from the same time the year before, this allows economists to understand whether prices have risen or fallen.
As can be seen in Figure 1 below, before 2021 CPI historically usually bobbed around at 2%, which is the Bank of England (BoE) target rate however, since the summer of 2021 prices of goods and services have been rapidly rising. By the start of 2022, inflation had hit 5.5%, more than double the BoE target rate. Over the year, inflation has continued to shunt upwards reaching its height in October 2022 at 11.1%, more than 5 times the target rate of the BoE. In October therefore, goods and services were on average 11.1% more expensive than they had been the same time the year before.
Figure 1: Consumer Price Inflation

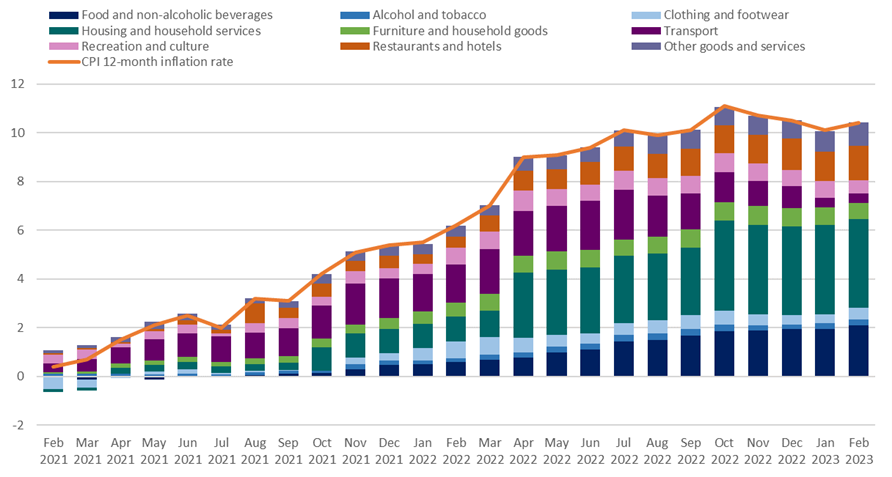
Figure 2 shows which groupings of goods and services have been rising the fastest and pushing up inflation over the last two years. The two largest drivers of inflation in this period have been housing and household services and food and non-alcoholic beverages. However, what is clear from the graph is that over this period almost every purchase category has seen rapidly rising prices.
Figure 2: Contributions to the annual CPI inflation rate UK
What is Driving rising prices?
Pent up Demand and reduced Output
The first initial driver of inflation was pent-up demand as the world began recovering from the pandemic. From the summer of 2021, as restrictions began to be lowered in many economies, demand for products and services boomed. Consumers wanted to spend money they had saved in the pandemic and go out and enjoy themselves after prolonged periods of isolation. Plus, as lockdowns ended employees returned to work and output again started to rise. However, this brought with it demand-pull inflation (Kekarainen, 2022). This is when an increase in demand causes prices of goods and services to increase, as supply can’t keep up with demand, often leading to increased prices. The sudden explosion in demand as people were released from lockdown in numerous economies, led to massive demand-pull inflation. Especially, as output globally had fallen in all sectors in the months previous, due to protective lockdown measures.
Then supply issues were compounded by differing recovery stances. Globally, manufacturing hubs, such as China, were much slower to remove Covid restrictions, this led to bottlenecks of supply and rising costs as producers struggled to find modes of transport for their goods. For instance, there was an under supply of shipping containers, which led to rapidly rising prices of transactional costs, as it become increasingly expensive to transport goods globally. Companies had to incorporate these rising costs into the prices of their products, this is when cost-push inflation began to come into play (Kekarainen, 2022). Cost-push inflation began to push up the cost of products as it became expensive for manufacturers to sell goods globally.
Russian Invasion of Ukraine
The next unprecedented economic shock was the return of war to Europe. The invasion of Ukraine in February 2022 shocked already brittle and fragile supply chains. Russia and Ukraine are producers of key raw and natural materials, as a result of the invasion, production and output have been severely impacted, reducing supply and increasing the price of these goods. Goods which have been severely impacted by the conflict include:
| FOOD & FERTILISER | Combined, Russia and Ukraine produced a third of the world’s wheat and a quarter of barley production, plus 75% of sunflower oil (Ramcharan, 2022). These are essential goods which are needed in the majority of food and drink production. The loss of such a large supply of these raw food materials sent shockwaves through the food and drink production industry. As the supply of these raw food and drink goods fell, the market price of these goods began to rise, and companies had to pass these costs on to consumers (Emediegwu, 2022). These shocks became particularly acute in April 2022 as the shortages began to hit the market and producers passed increased costs onto consumers, as seen in Figure 2.
Similarly, Russia is one of the world’s largest exporters of fertiliser. Following the Russian invasion many countries implemented sanctions, and whilst specific exemptions were put in place for fertilisers to allow for the continued supply of fertilisers, exports of fertilisers have still fallen foul of the measures designed to isolate the region (Broom, 2023). This has resulted in large falls in the supply of fertiliser, which has significantly affected the costs around growing crops, as the cost of fertiliser has dramatically increased due to the fall in supply (Eardley, 2022). Many suppliers are then forced to pass on these costs to consumers. |
| ENERGY SUPPLY | Following the Russian invasion of Ukraine, energy prices rapidly increased. Russia is the second largest producer of natural gas and oil (Ritchie et.al, 2022), and sanctions were placed on Russian-produced fossil fuels, as a result, energy prices rapidly increased. In the UK energy prices have more than quadrupled since 2021 (Pugh, 2022), and in Europe, energy prices more than doubled between February 2022 and July 2022 (Gazzani and Ferriani, 2022). The rise in energy prices can be seen in figure 2 and has been the largest contributing factor to CPI since April 2022 and has been one of the largest contributing factors in producer price inflation over this period also (ONS, 2023). The rise in energy costs did not only impact households, but it also led to increased production costs for all businesses. Businesses have tried to absorb energy prices however, the rapid increase in costs associated with energy has led to many consumers having to pass these costs onto consumers, driving up cost-push inflation.
The UK is a net importer of energy, making it more vulnerable to energy market shocks. Being a net importer of energy leaves the UK with lower energy security and control over prices, when there is disruption to the energy supply therefore, it is far more vulnerable to energy price rises than net exporting countries (ONS, 2023). |
| FUEL SUPPLY
|
Oil prices rose rapidly following Russia’s invasion of Ukraine (Bolton, 2023), as sanctions were placed on Russian-produced goods including fuel, reducing supply and increasing prices. This increased transport costs, alongside increased input costs in other areas, led to firms having to raise the costs of their goods adding to inflation (British Chambers of Commerce, 2022). |
Brexit
Globally all comparable economies to the UK have been impacted by the pandemic and the Russian invasion, however, only the UK still has double-figure inflation. Whilst inflation is coming down across Europe and North America, it is remaining stubbornly high in the UK (Romei and Smith, 2023). Brexit is likely part of the reason that it is remaining stubbornly high in the UK.

Research from the University of Sussex found that businesses had struggled to adapt to the new Trade and Cooperation Agreement (TCA), with the largest impacts being increased costs, increased red tape and bureaucracy and shipping and transport delays (Clarke et.al, 2023). Businesses also stated that they were suffering competitive disadvantages and loss of trade with the EU three times more in 2022 than in 2021. Just over 35% of firms identified that Brexit was to blame for their supply chain issues in 2022, not Covid-19 which 31% of respondents blamed for their supply chain issues (Clarke et.al, 2023). When surveying business on the TCA the British Chambers of Commerce (2022) found:
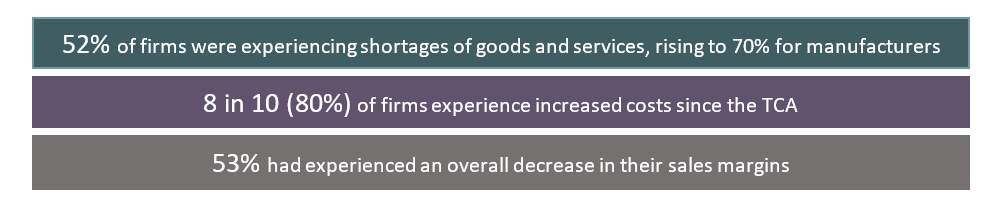
Further research from Ivalua found that 80% of UK businesses found Brexit to be the biggest disrupter to supply chains in 2022, followed by the invasion of Ukraine (76%), rising energy costs (71%) and Covid-19 (59%) (Ivalua, 2022). Another survey found Brexit has had a significant increase in costs, with prices of raw materials (43%), imports and exports (42%) and manufacturing and production (42%), for UK businesses (England, 2022). Controlling for the impact of the pandemic, UK in a Changing Europe found that UK EU trade barriers led to a 6% increase in food prices in the UK between the end of 2019 and 2021 (Bakker et.al, 2022).
Essentially, Brexit has compounded the problems generated by the pandemic and the invasion of Ukraine. Europe is the UK’s biggest trading partner (Ward, 2022), and the self-imposed increase in trade barriers with the trading block, has increased costs for many firms. As it has led to trading delays and supply shortages, similar to that generated by the pandemic and invasion. So, whilst other economies are starting to recover from the pandemic and the war in Ukraine, or certainly stabilise, the UK is suffering the third shock of leaving the EU.
Tight Labour Market
The UK is currently experiencing a tight labour market, due to rising inactivity, increasing long-term illness, early retirement and reduced skilled immigration. Long-term illness has been driven by the pandemic, its impact both on people’s health and its impact on NHS backlogs, preventing people from returning to work. Many older workers have retired following the pandemic. Reducing the availability of labour, and tightening the labour market. This is leading to higher costs for firms, as they are having to increase wages to compete for employees during a labour supply shortage and this is compounded by rising inflation. With private sector wages growing on average by 6.9% last year compared to the year before, public sector wages grew 2.7% over the same period (ONS, 2022). This was the largest growth in private sector pay, excluding during the pandemic, that the UK has ever seen.

Private sector pay rises are more likely to be inflationary than public sector pay rises, as the private sector businesses will raise prices to mitigate the increased wage costs, adding to inflation. Plus, the private sector employs 83% of the active workforce, comparative to 17% employed by the public sector, meaning wages in the private sector are much more likely to lead to an increase in inflation (Whiteley, 2023). However, as the current wage rises are being driven by rises in labour supply shortages the inflationary impact is relatively weak overall (Whiteley, 2023).
Summary
The largest drivers of inflation which are fuelling the cost-of-living crisis have been the reopening of economies when recovering from the pandemic, followed by the Russian invasion of Ukraine. When reopening after the pandemic there was massive demand-pull inflation at a time when there was little output to cope with demand, fuelling inflation. Heightened by economies reopening at differing speeds. The invasion of Ukraine then led to further supply shortages, particularly in basic necessity food goods (e.g. grain and cooking oil) and energy fuels (e.g. oil and natural gas). This loss of these basic food goods has fed through to all corners of the food production market, as Russia and Ukraine are two of the largest producers of these food stuffs, rising inflation across the entire food production market. The loss of energy supplies by the world’s second-largest producer also led to rapidly rising energy prices not only for households but for producers, which have then been forced to pass on the rising input costs to consumers. Energy also impacts every UK business, which has seen their energy bills more than quadruple.
However, all economies have been facing these issues and inflation is higher in the UK compared to other comparable economies. This is likely because the UK is a net importer of the majority of goods and energy supplies which have been impacted by these two economic shocks, making the UK more vulnerable to such shocks. Plus, Brexit is also leading to delays and shortages compounding supply issues, and increasing costs for British firms, which are then passing on those cost rises through higher prices.
Rises in private sector pay may be contributing to increased inflation, as there is a skills shortage driving higher wages, which is then being passed on to consumers in the form of higher prices. However, this is a weaker driver of inflation as the majority of these wage rises are to tackle skills shortages, rather than demands for higher wages. Public sector pay rises are very unlikely to be influencing inflation as there has been only a 3% rise in pay over the last year, compared to 7% in the private sector. The private sector employees 83% of the workforce and the public sector only employees 17%.
Read the full REDI-Updates report.
This blog was written by Alice Pugh, Policy and Data Analysts for City REDI and WM REDI.
Disclaimer:
The views expressed in this analysis post are those of the authors and not necessarily those of City-REDI or the University of Birmingham.