Alice Pugh takes an in-depth look at the Autumn Statement and what it means for the West Midlands.

For futher analysis see: The Autumn Statement - Key Announcements
The Autumn Statement was finally released last week detailing government tax and spending plans. The budget comes at a time of significant political and economic turbulence. The government has significant challenges that it will need to tackle if it wants to encourage growth and levelling up.
The Autumn Statement – The Impact on the West Midlands
Energy Bills – Households
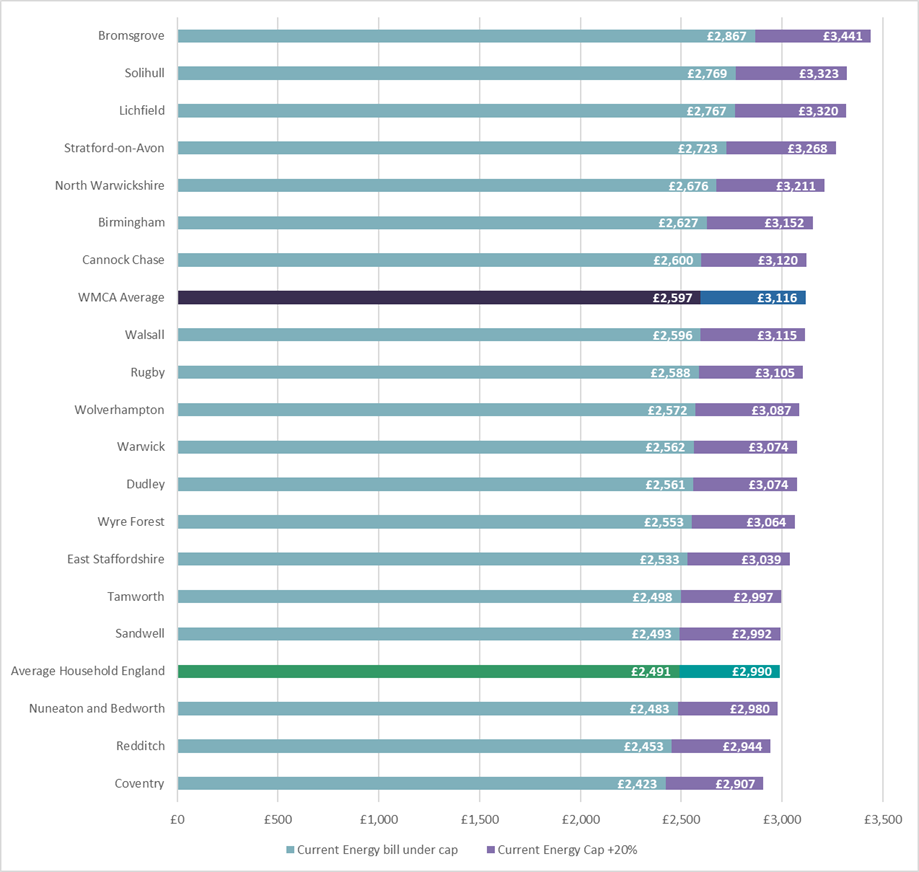
Unit price data for gas and electricity, under the new April energy price cap have not yet been released yet. However, the total cap will increase by 20% from April, compared to the current cap, increasing from £2,500 to £3,000. Based on previous City REDI predictions on household energy bills, a 20% rise will lead to the England average bill (based on the average energy usage) will increase from £2,491 to £2,990. The average energy bill for a West Midlands Combined Authority (WMCA) household will increase from £2,597 to £3,116 from April. The average WMCA household energy bill will see a £519 increase from April. However, it should be noted that this is based on the average UK household, energy prices do vary based on energy usage and geographical location.
[1] These calculations are based on direct debit payments; rates will vary by payment method as well as region and meter type.
[2] 2019 consumption was used for this analysis, as it was thought the average 2020 (latest update) usage would be unusually high for domestic dwellings, due to lockdowns during the pandemic period. Figures energy usage estimates are from ONS Sub-national electricity consumption statistics from 2005 to 2020 and Sub-national gas consumption statistics from 2005 to 2020.
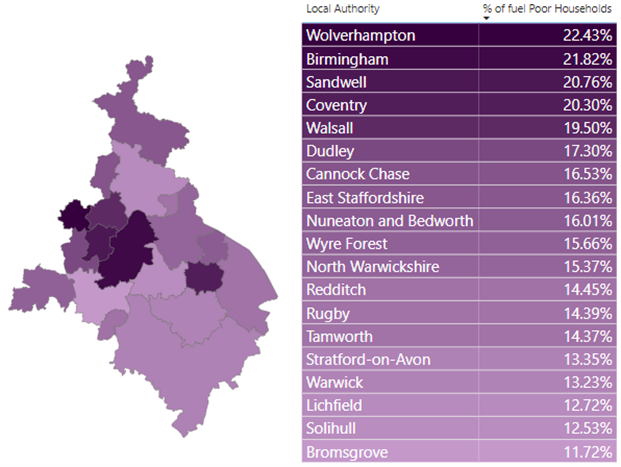
The England average £1,138 price cap was April 2021, comparative to this the new price cap is a 163% increase for the England average household bill from April 2023. The new average WMCA household energy bill is 174% higher than the average England energy bill in April 2021. This is going to severely impact WMCA households, across the WMCA in 2020 average household poverty was already 18.3%. However, fuel poverty varies greatly by local authority, with poorer local authorities generally having higher levels of fuel poverty, as seen in figure 2 below. The new cap will further push more households into poverty next April, as energy bills rise at a faster rate than expected pay. Leaving households with lower disposable income during a recession.
Businesses
The figure below shows forecasted energy builds for businesses from April 2023 compared to the October price cap (the current cap) and the September 2021 price cap, based on forecasted unit energy prices from Cornwall Insight for April 2023 and average energy usage by business size. As the government did not mention a business energy cap similar to the household cap from April, businesses will face rapidly rising energy bills in the coming months. With energy bills rising by 140% to 157% dependent on the volume of energy usage, from October 2022 to April 2023.
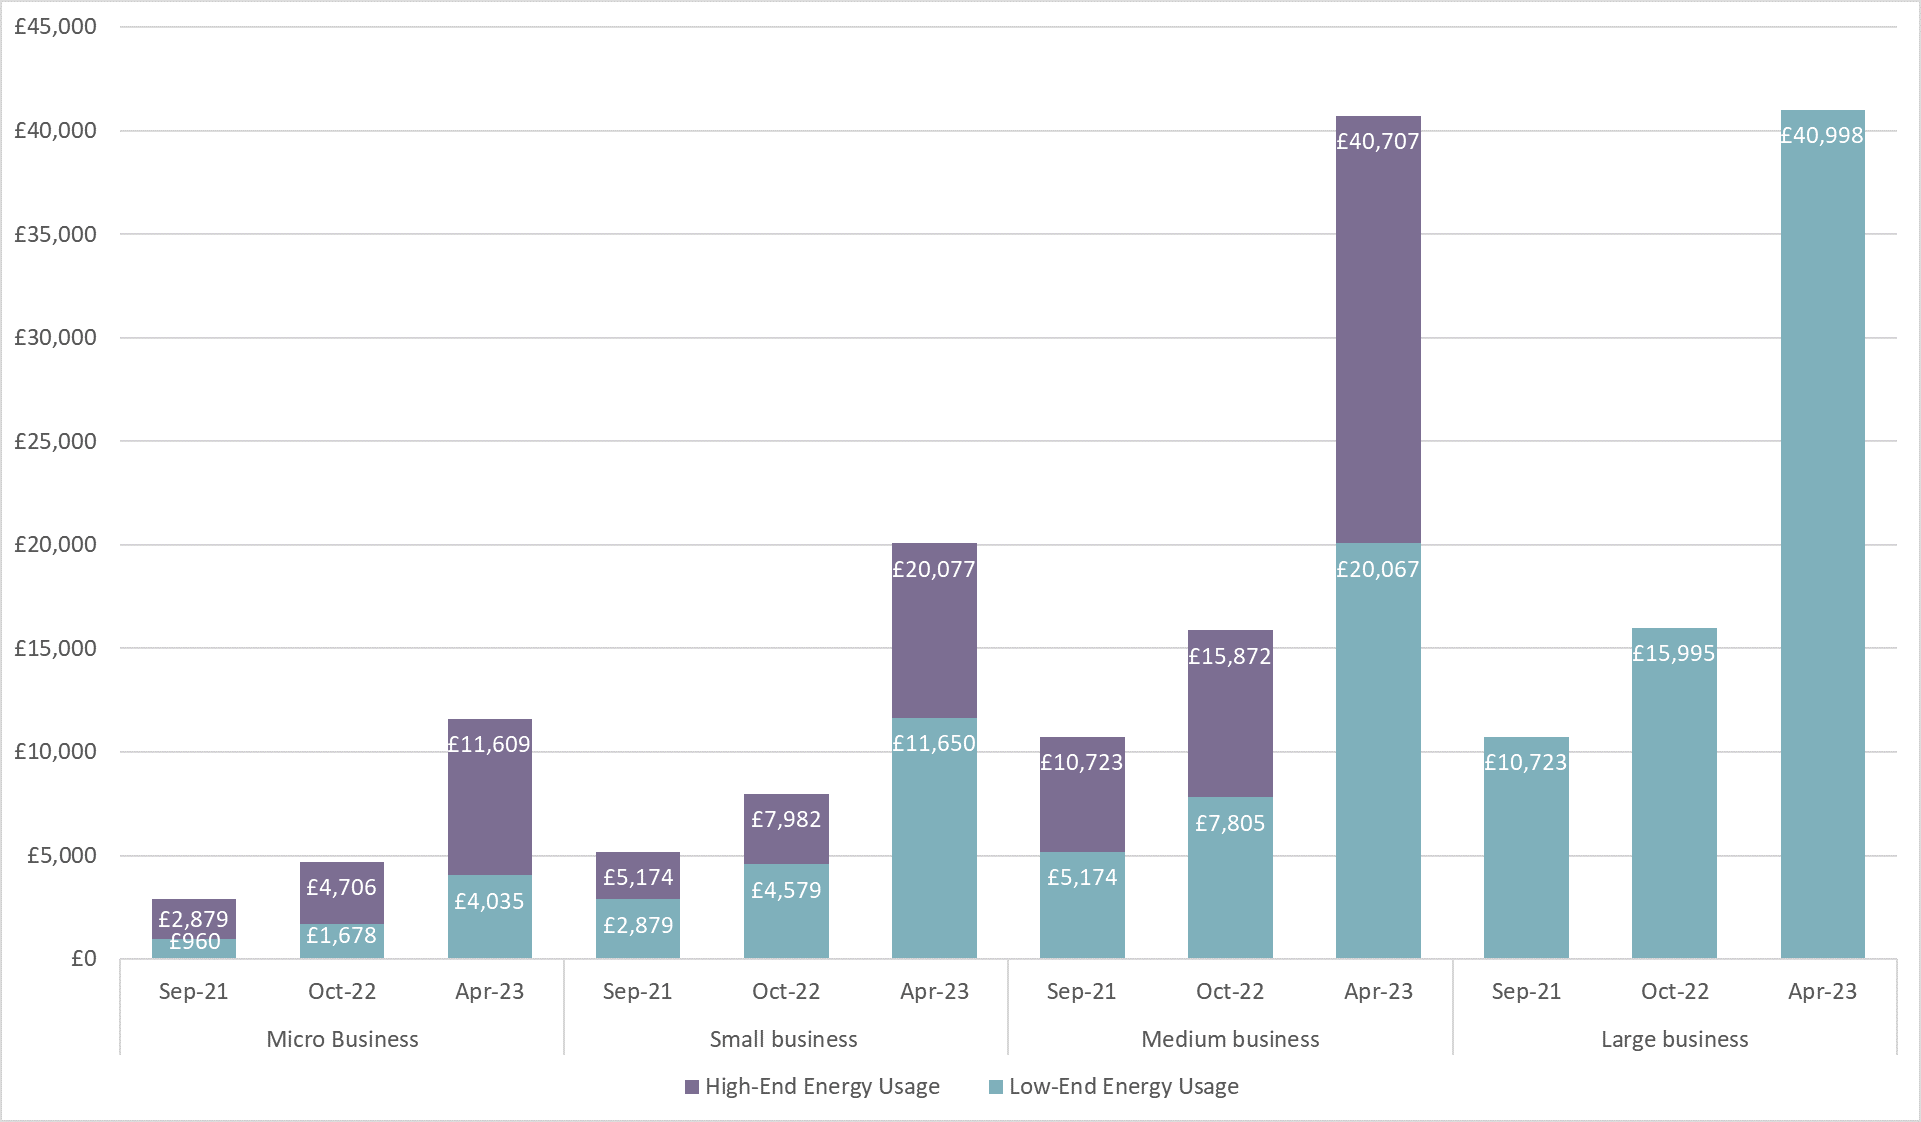
In Autumn last year electricity prices were £116.96 per MWh, the cap which was introduced in October £211 is an 80.4% increase on last year’s prices. Gas prices were around £38 per MWh in Autumn last year, the £75 cap is a 95.6% increase in prices. So, companies have already seen bills increase under the current cap by 90% since Autumn 2021, if there is no support offered from April, then since Autumn last year, businesses will have seen their energy bills increase between 282% and 320% based on consumption levels. This will be devasting for many businesses, especially those already struggling with high energy costs. Red Flag Alert data shows 8,054 businesses are at risk of closure, due to rising energy prices and their low financial stability rating. Plus, businesses will likely be forced to push a proportion of this cost onto consumers, which has the potential to push energy prices further. However, how high prices will go will depend on the demand for energy over the winter and the stability of global energy markets.
Taxes
Business Rates
The revaluation of business rates will come into effect from April 2023. Business rates are linked to property values and non-domestic property values have not been revaluated since 2017, based on 2015 rateable prices at the time. Since the pandemic non-domestic property prices have sharply decreased, however business rates have remained high being linked to the 2017 valuations. The revaluation will likely benefit the majority of businesses on high streets where property values have fallen.
However, warehouse and distribution spaces have rapidly increased in value and therefore, businesses with this sort of workspace will likely see increases in business rates contributions. Historically, online retailers have accounted for 20% of total retail sales but only paid 6% of total business rates, compared to high street retailers who paid 96% of business rates and accounted for 80% of sales. The revaluation of non-domestic properties will likely lead to an improvement in the balance of business rates paid by online retailers.
Whilst this is beneficial for many businesses, it may adversely affect some local authorities. Business rates are now the largest source of income for many local authorities, a reduction in business rates will lead to potential falls in income from this source. This will tighten the budgets of local authorities even further, as income will potentially decrease, especially for city local authorities where a large proportion of businesses are high street based.
Income Tax
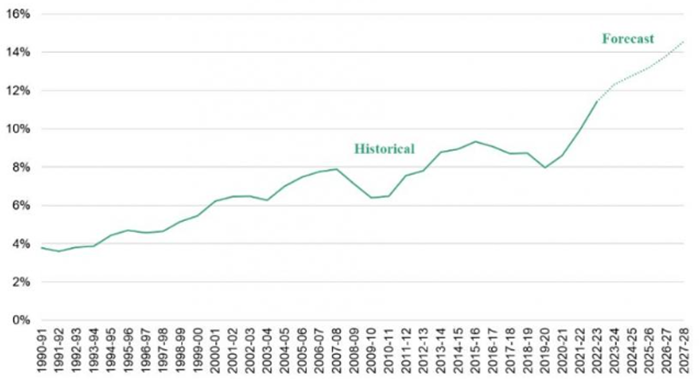
The government has frozen income tax thresholds which will means that more people will be brought into tax or see their marginal tax rate increase. According to the IFS by 2027-28, the total number of people paying income tax will have risen from 34 million to 35.6 million (rising from 63% to 66% of the adult population retrospectively). With the number of higher- or additional-rate taxpayers is set to rise from 6.1 million to 7.8 million (11% and 15% of the adult population respectively). This is the highest proportion of adults paying tax since the beginning of individual income tax, as seen in the graph below.
The freezing of income tax allowances is also referred to as “fiscal drag”, this describes the stealthy process of pulling more people into paying income tax and as well as pushing others to pay higher rates of tax. Blick Rothenburg highlighted, 6 years of this freeze till 2028, will be stealth taxation on an unprecedented scale. For small businesses the frozen VAT registration threshold at £85,000 could also be seen as a stealth tax. As the rate won’t rise in line with inflation, meaning if businesses earn more as a result of rising prices, they will have to then register to pay VAT.
The additional rate threshold of income tax being lowered to include those earning over £125,1440 from April 2023, will increase the number of additional rate taxpayers by 350,000. This will bring the total number of people paying this level of tax to around 1 million people, from 236,000 when the additional rate of tax was first introduced, according to the IFS.
Benefits and Wages
National Living Wage
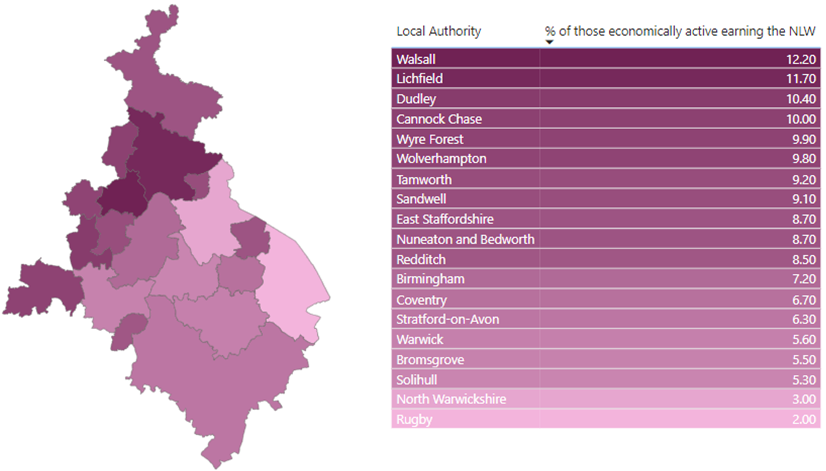
Across the WMCA 8.6% of people (121,600 people) who are economically active are earning the National living wage (NLW) (minimum wage for those aged 23+). However, this varies by the local authority (figure 5) with the highest proportion of NLW earners being in Walsall (12.2%), Lichfield (11.7%) and Dudley (10.4%). Whereas the lowest proportion of NLW earners is in Rugby (2%), North Warwickshire (3%) and Solihull (5.3%). So, the impact on residential populations will vary by local authority. For earners working full time and earning the national minimum wage this will increase annual income by £1,634 annually.
State Pension, means tested and disability benefits
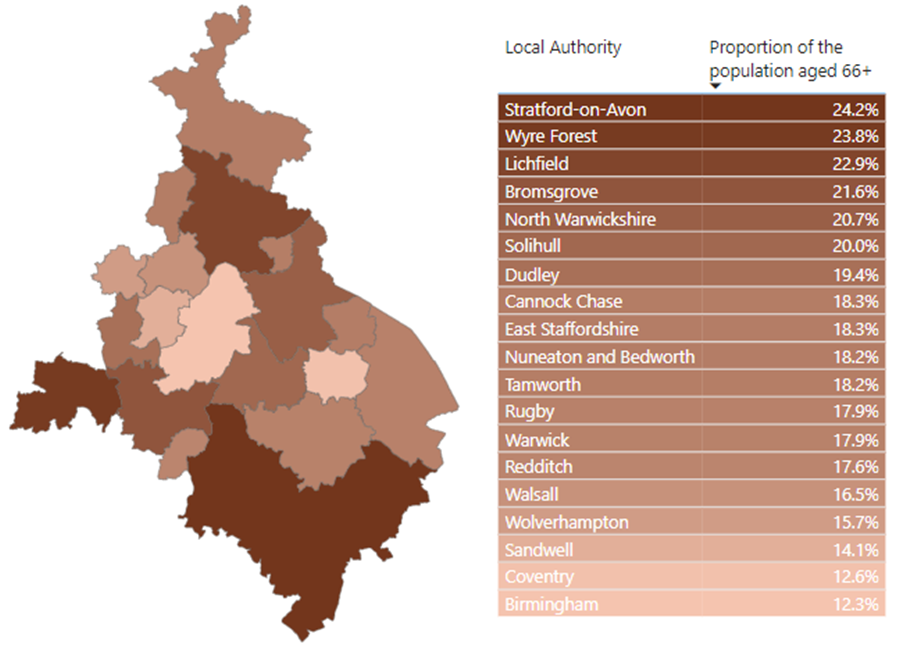
These are set to rise in line with inflation at 10.1%, increasing weekly payments from £156.20 or £203.85 dependent on the pension payment. Increasing state pension payments for 94,845 individuals within the WMCA. This should maintain pension claimants living standards over the next few months, however, when the new energy bill comes into effect they will likely be significantly impacted. This will likely impact areas with high numbers of state pension age claimants. The figure below shows percentage of the population which is over the age of 66 (state pension age). Unsurprisingly, more rural affluent areas, such as Stratford-Upon-Avon and Lichfield, have the highest percentage of their population aged 66+, at 24.2% and 23.8% retrospectively. Comparative, to more urban less affluent areas, such as Birmingham and Coventry, where that state age pension accounts for only 12.3% and 12.6% retrospectively. Therefore, rural local authorities in the combined authority are more likely to be impacted by this change.
82,116 people claiming disability benefits, and 176,130 people receiving housing benefits, alongside other means-tested benefit claimants in the WMCA will see them rise with the 10.1% level of inflation. This should help to protect their benefits from real-term falls in the coming months unless inflation continues to rise rather than decline, as forecasted in the coming months. However, it will only retain their current level of income, this is not an increase in the real value.
Trailblazer deal
The government has announced it will continue with the “trailblazer” devolution deals within the West Midlands Combined Authority. This will devolve greater powers such as skills, transport and housing. Until now there was uncertainty that these deals would continue as political uncertainty had hindered progress towards the deal. The deals could see WMCA receive single departmental-style funding at the next spending review. This would provide the WMCA and local partners with more flexibility and greater accountability over key economic growth funds. Thus, providing greater funding, which is non-competitive, with competitive funding being an issue which has hindered cooperation and collaboration between local government institutions for a number of years.
Tough times ahead
The UK is officially in a recession, having never fully recovered from the previous. Inflation is set to erode real wages and reduce living standards by 7% by the 2023 financial year, wiping out the last 8 years of growth. Real disposable household incomes are set to remain lower at the start of 2028 than they were before the pandemic hit in 2019. With real wages not expected to return to their 2008 level until 2027. For workers, this is an unprecedented 19-year pay downturn, which has cost workers £15,000 per year compared to if their wages had continued to rise at the pre-financial crisis rate.
However, unlike in the ‘mini-budget’ this budget distributes the burden far more evenly over the different income brackets. The middle is expected to become the most squeezed, as rising incomes over the next few years pull more and more into higher tax brackets. Additionally, spending and cuts which are eventually expected to be introduced are highly dependent on growth in the economy in the coming years. Something which has been seemingly difficult for the UK to get a full grasp on in recent years, especially with stagnant productivity. If growth does not improve, then this may deepen the forecasted spending cuts.
Additionally, this budget is also highly reliant on a falling energy prices in the coming years. The UK is a net importer of energy and ultimately beholden to prices on global energy markets, so there is no guarantee that energy prices will fall. If energy prices were to continue to rise this would almost certainly place even greater spending pressures on the government’s budget, with OBR estimating that the Chancellor will have £9.2bn headroom over the next 5 years, which could quickly be wiped out by increasing energy prices.
Overall, the next few years are going to be extremely difficult for most. The majority are set to see higher taxes, higher energy bills, and poorer public services than was previously anticipated. The middle will be squeezed, real incomes will fall, and there will be a return to austerity. We are likely in for another challenging decade, following the challenging decade we have already had.
This blog was written by Alice Pugh, Policy and Data Analyst for City REDI / WMREDI, University of Birmingham.
Disclaimer:
The views expressed in this analysis post are those of the authors and not necessarily those of City-REDI or the University of Birmingham.