 In this blog, Tasos Kitsos looks into the latest data on claimant counts and discusses aspects of the evolving COVID-19 economic crisis.
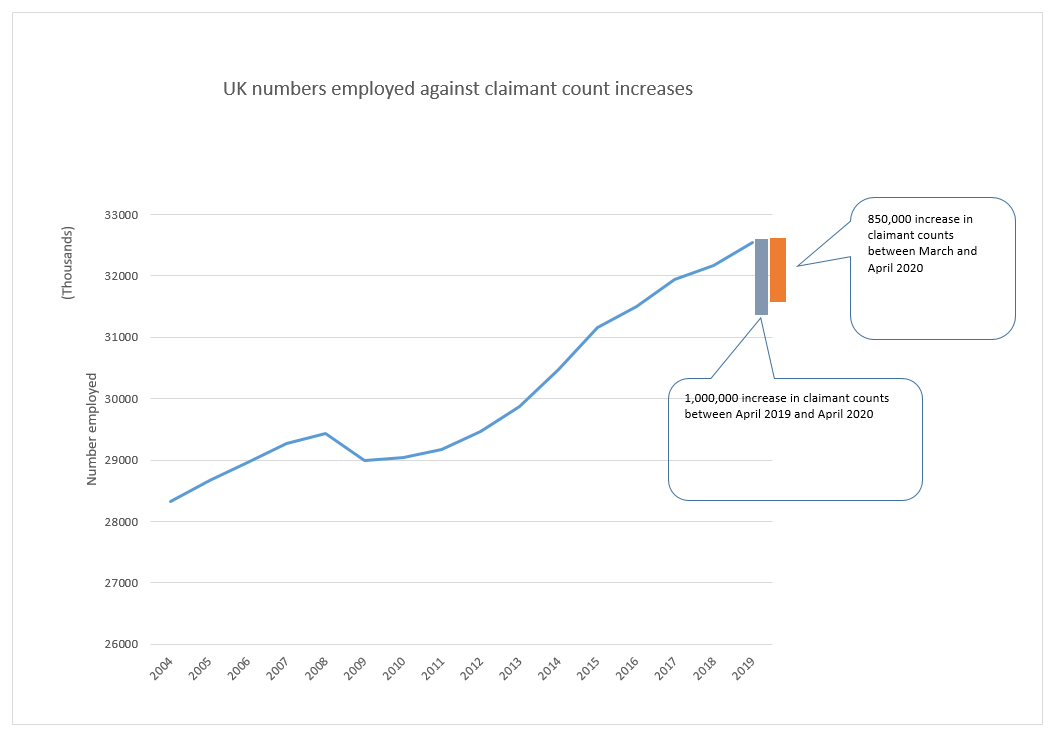
In the midst of the COVID-19 health crisis, evidence begins to appear on the magnitude of the economic impact that the pandemic is expected to have. The April 2020 claimant count rates have recently been published by the Office for National Statistics and show that compared to April 2019 there are one million more claimants in the country, with an 850,000 increase from March 2020 (graph below). If these reflect jobs lost, the UK economy has lost the equivalent of all employment created since 2016.
There is a lot to be said on the characteristics of this data and in particular their comparability in time. Not everyone is claiming unemployment benefits and this is dependent on savings, knowledge of the benefits system and opportunity costs in general. NOMIS also provides a useful overview of the changes in measuring claimant counts here. Hence their designation to experimental vs official statistics given to the series by ONS. Subject to these constraints, claimant counts are the only available data at the subnational level (at the moment of writing) that can help us gauge the impact of the COVID-19 crisis in local labour markets. They are used here with caution to look at:
- The distribution of the April-2020 claimant count rates across Local Authority Districts (LADs)
- The distribution of the increases in the claimant count rates
- Their relationship between last year’s increases and last year’s performance
- The relationship between last year’s increases and the 2008 crisis.
-
The distribution of the April-2020 claimant count rates across Local Authority Districts (LADs)
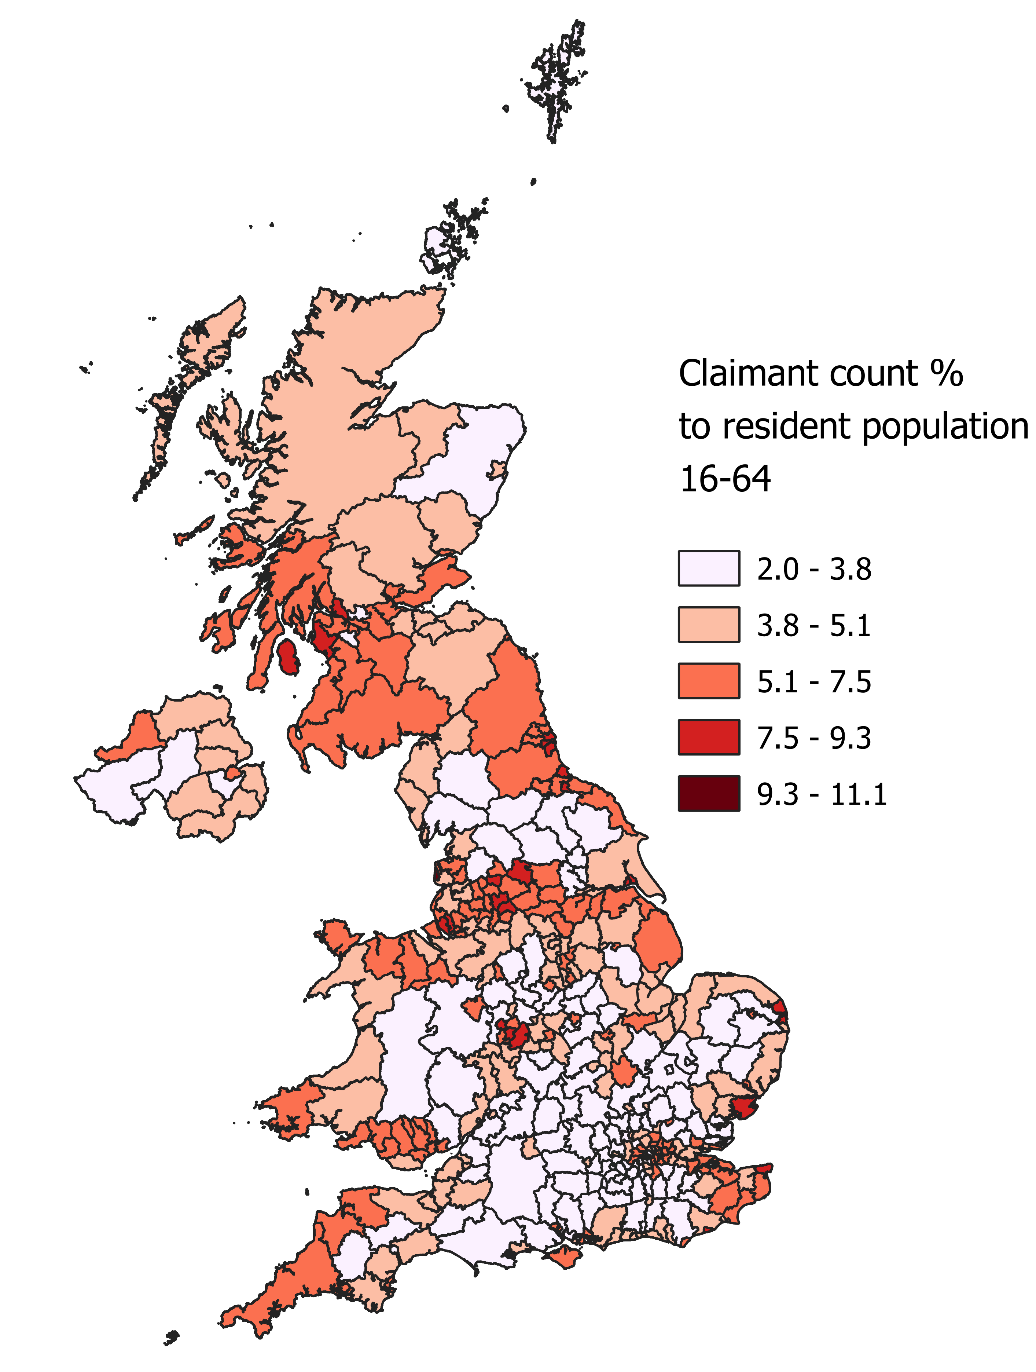
The table and map below show the spatial distribution of claimant counts as a share of the total resident population aged 16-64. The table shows the worst and best performances in terms of claimant count rates in 2020. Places that have traditionally had above-average rates continue to do so with Blackpool having the worst performance with one in 10 residents claiming unemployment benefits. A figure that doubled compared to April 2019. Two local authorities that are part of the West Midlands Combined Authority are among the worst performers suggesting an acute problem for the combined authority.
The table also shows the difference in claimant count shares compared to the same month (April) the year before for 2009 and 2020 to show how unprecedented some of these changes are for some places. Although it should be noted that the definition of claimants has changed between the two periods.
| Place | Claimant Count (CC) share 2008 | CC share 2009 | CC share 2019 | CC share 2020 | CC share annual difference 2009 | CC share annual difference 2020 |
| Blackpool | 3.2 | 5.3 | 5.6 | 11.1 | 2.1 | 5.5 |
| Middlesbrough | 4.8 | 6.8 | 5.5 | 9.1 | 2.0 | 3.6 |
| South Tyneside | 4.4 | 7.0 | 6.1 | 9.0 | 2.6 | 2.9 |
| Birmingham | 5.0 | 7.2 | 6.0 | 9.0 | 2.2 | 3.0 |
| Wolverhampton | 4.7 | 7.0 | 5.6 | 9.0 | 2.3 | 3.4 |
| United Kingdom | 2.1 | 3.9 | 2.7 | 5.1 | 1.8 | 2.4 |
| Waverley | 0.6 | 1.7 | 0.7 | 2.2 | 1.1 | 1.5 |
| Wokingham | 0.6 | 2.0 | 0.9 | 2.2 | 1.4 | 1.3 |
| South Northamptonshire | 0.7 | 2.3 | 0.8 | 2.1 | 1.6 | 1.3 |
| South Cambridgeshire | 0.7 | 1.8 | 0.7 | 2.0 | 1.1 | 1.3 |
| Hart | 0.6 | 1.6 | 0.6 | 2.0 | 1.0 | 1.4 |
| Source: Author’s elaboration of ONS data | ||||||
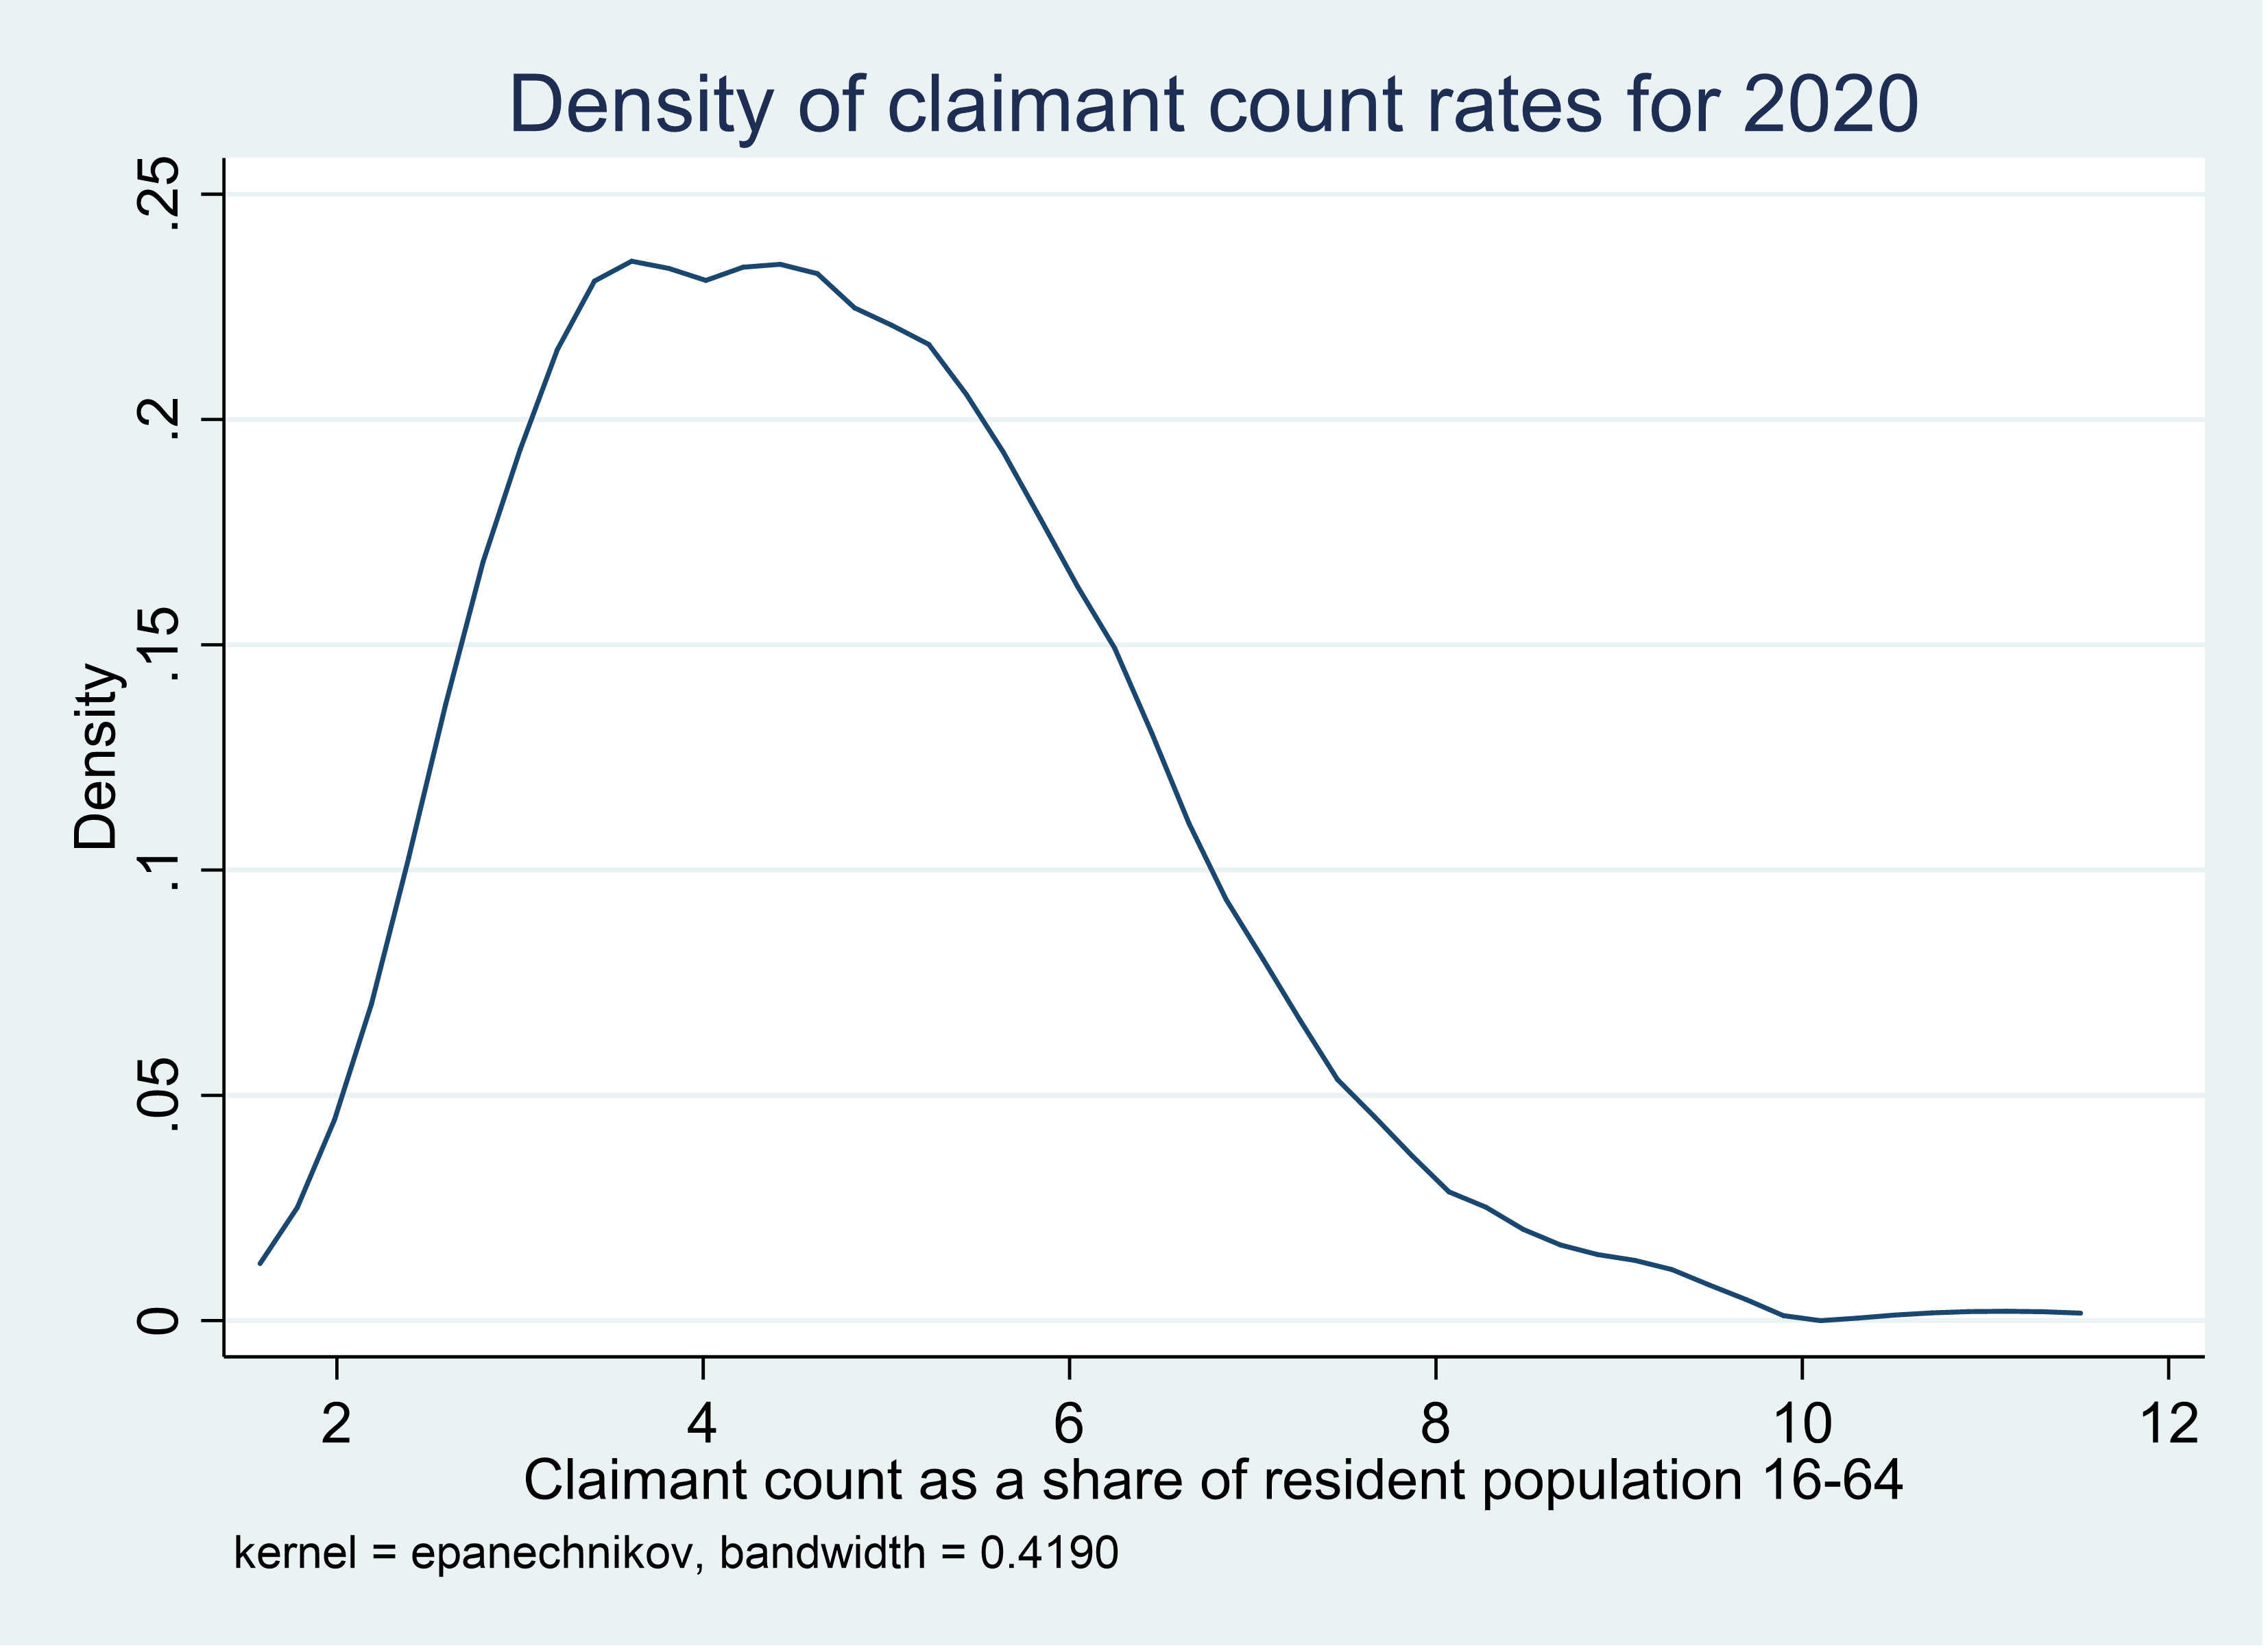
Of the 382 Local Authority Districts (LADs) in the data, 138 have above average claimant count rates and 244 below average. This is evident in the density plot that follows and shows how far some places are from the UK average and the effort needed to address this challenge.
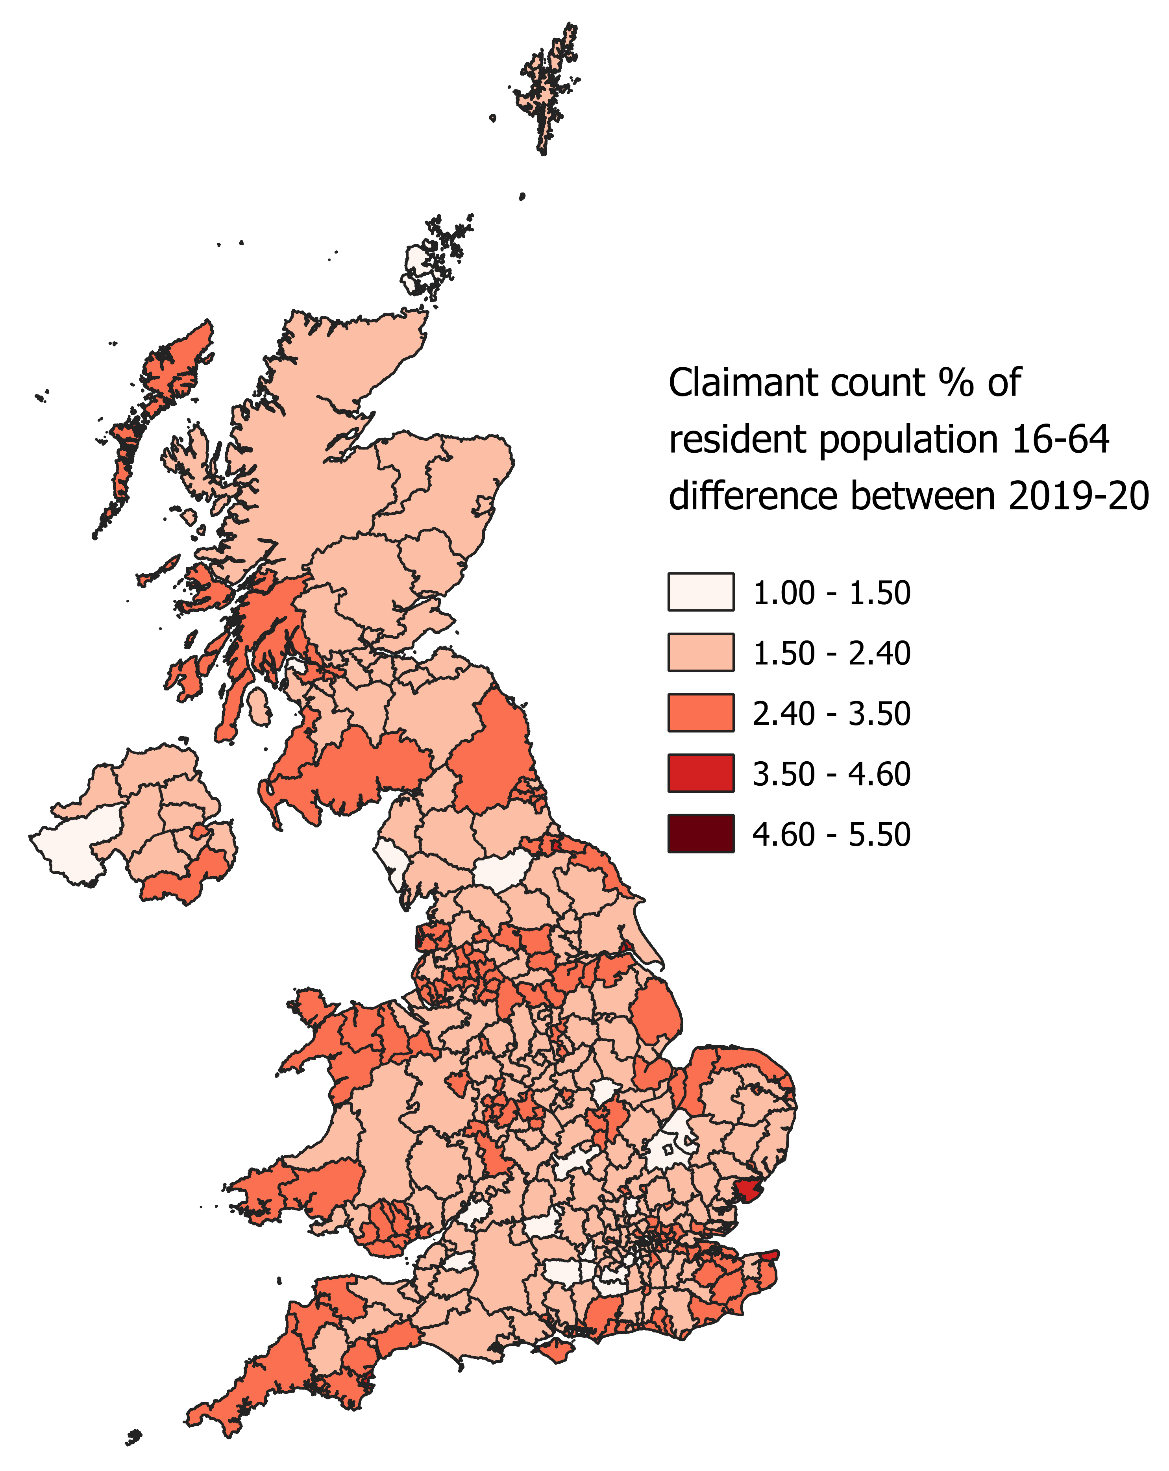
2. The distribution of the increases in the claimant count rates
The second way to look into the claimant count data is with respect to the annual difference between the shares of claimant counts. The table below shows the best and worst performers with respect to the increase of claimant count rates among the resident population 16-64 between April 2019 and 2020. Blackpool continues to have the biggest increase despite already having double the average claimant count rate in 2019 (5.6% compared to 2.7% for the UK). However, the claimant count increases have been a shock in some other places such as the Isles of Scilly where from a rate of 0.6% in 2019, claimant counts have spiked at 5.8% in April 2020. Similarly, the group of best performers include a mix of consistently low rates places such as South Cambridgeshire and Oxford as well as places that are more likely to be hit in the future via less direct channels.
| Place | CC share 2008 | CC share 2009 | CC share 2019 | CC share 2020 | CC share annual difference 2009 | CC share annual difference 2020 |
| Blackpool | 3.2 | 5.3 | 5.6 | 11.1 | 2.1 | 5.5 |
| Isles of Scilly | 0.3 | 0.6 | 0.6 | 5.8 | 0.3 | 5.2 |
| Torbay | 2.2 | 4.5 | 3.1 | 7.1 | 2.3 | 4.0 |
| Kingston upon Hull, City of | 4.7 | 7.9 | 4.7 | 8.6 | 3.2 | 3.9 |
| Tendring | 2.5 | 4.6 | 4.0 | 7.7 | 2.1 | 3.7 |
| United Kingdom | 2.1 | 3.9 | 2.7 | 5.1 | 1.8 | 2.4 |
| South Cambridgeshire | 0.7 | 1.8 | 0.7 | 2.0 | 1.1 | 1.3 |
| Oxford | 1.5 | 2.8 | 1.7 | 3.0 | 1.3 | 1.3 |
| Copeland | 2.4 | 3.2 | 3.2 | 4.4 | 0.8 | 1.2 |
| Vale of White Horse | 0.6 | 1.9 | 1.2 | 2.4 | 1.3 | 1.2 |
| Inverclyde | 3.5 | 4.8 | 5.1 | 6.1 | 1.3 | 1.0 |
| Source: Author’s elaboration of ONS data | ||||||
3. Their relationship between last year’s increases and last year’s performance
From the discussion so far and in previous blogs, we have seen that it is expected that the COVID-19 economic crisis will have an uneven spatial footprint. This begins with the differential impact among sectors either via demand shocks or shares of local employment in lockdown and continues with differences in resilience factors such as innovation capacities and efficiency of support (see here for a collection of City-REDI insights on the economic impact of COVID-19).
Using the claimant counts data, we can explore the relationship between the April 2019-20 increase in claimant count rates and the performance of LADs in 2019 (graph below). Although there are clear outliers, a positive correlation can be seen suggesting that places that had high rates of claimants in 2019 have also seen high increases between April 2019 and April 2020. The results should be treated with caution since the current crisis is still unravelling and other factors (such as savings and knowledge of the benefits system) may impact the ability of people to claim.

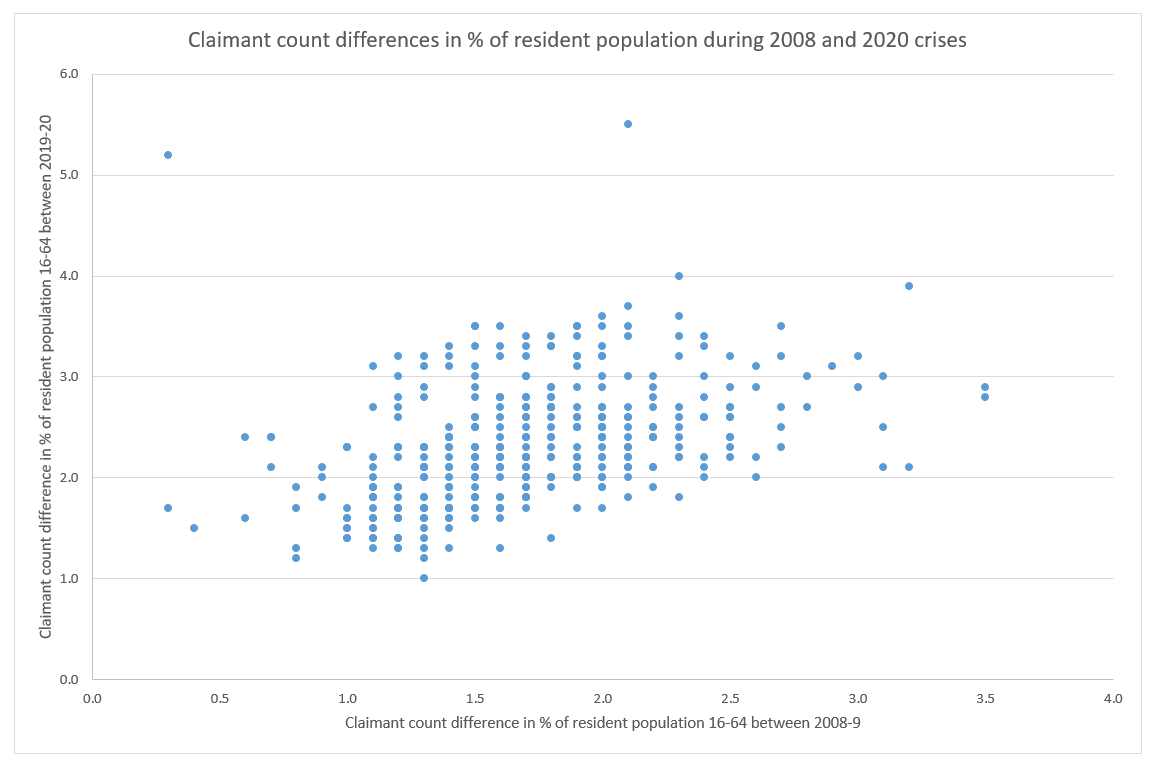
In an even riskier attempt, I plot the increase in the claimant count rates between April 2019-20 against the increase in claimant count rates between April 2008-9 (graph below). This allows us to see the relationship between the resilience (or lack of) of places in the 2008 crisis and the emerging COVID-19 crisis. The picture here is less clear with places in the middle of increases in 2009 (X-axis between 1.0 and 2.3) showing a range of performances during the 2020 crisis.
4. The relationship between last year’s increases and the 2008 crisis.
In an even riskier attempt, I plot the increase in the claimant count rates between April 2019-20 against the increase in claimant count rates between April 2008-9 (graph below). This allows us to see the relationship between the resilience (or lack of) of places in the 2008 crisis and the emerging COVID-19 crisis. The picture here is less clear with places in the middle of increases in 2009 (X-axis between 1.0 and 2.3) showing a range of performances during the 2020 crisis.
Conclusion
Overall, despite being too early to identify the full extent of the coronavirus crisis, a varying spatial footprint emerges. Some places already show significant and unprecedented increases in claimant count rates whilst others appear to weather the crisis so far. As discussed, this could be due to the nature of the data or the differential resilience capacities among places. In any case, this evidence suggests that policy efforts will need to vary by place in terms of intensity and timing for the country to exit the crisis without increasing spatial inequalities.
Indicative further reading on local economic resilience
BRISTOW, G. & HEALY, A. 2014. Building Resilient Regions: Complex Adaptive Systems and the Role of Policy Intervention. Raumforschung und Raumordnung, 72, 93-102.
BRISTOW, G. I., HEALY, A., NORRIS, L., WINK, R., KAFKALAS, G., KAKDERI, C., ESPENBERG, K., VARBLANE, U., SEPP, V., SAGAN, I., MASIK, G., SENSIER, M., HARDING, A., SWASH, A. & CAREY, H. 2014. ECR2. Economic crisis: Regional economic resilience. [Project Report]. ESPON. Brussels, Belgium.
FRATESI, U. & PERUCCA, G. 2018. Territorial capital and the resilience of European regions. The Annals of Regional Science, 60, 241-264.
KITSOS, A. 2020. Economic resilience in Great Britain: an empirical analysis at the local authority district level. In: BRISTOW, G. & HEALY, A. (eds.) Handbook on Regional Economic Resilience. Cheltenham: Edward Elgar.
KITSOS, A. & BISHOP, P. 2018. Economic resilience in Great Britain: the crisis impact and its determining factors for local authority districts. The Annals of Regional Science, 60, 329-347.
KITSOS, A., CARRASCAL-INCERA, A. & ORTEGA-ARGILÉS, R. 2019. The Role of Embeddedness on Regional Economic Resilience: Evidence from the UK. Sustainability, 11.
LEE, N. 2014. Grim down South? The Determinants of Unemployment Increases in British Cities in the 2008–2009 Recession. Regional Studies, 48, 1761-1778.
City-REDI / WM REDI have developed a resource page with all of our analysis of the impact of Coronavirus (COVID-19) on the West Midlands and the UK. It includes previous editions of the West Midlands Weekly Economic Monitor, blogs and research on the economic and social impact of COVID-19. You can view that here.
This blog was written by Dr Tasos Kitsos, Research Fellow, City-REDI / WM REDI, University of Birmingham.
To sign up for our blog mailing list, please click here.
Disclaimer:
The views expressed in this analysis post are those of the authors and not necessarily those of City-REDI / WM REDI or the University of Birmingham