 In this blog, Tasos Kitsos looks into the spatial heterogeneity in the distribution of industries currently shut down in the UK.
As the COVID-19 pandemic continues to develop, we begin to realise the potential economic impact from the oncoming recession. The Office for National Statistics has moved with unprecedented speed to gather data on the challenges faced in labour markets and businesses. Wave 2 of the Business Impact of Coronavirus Survey finds that 25% of businesses have shut down, 30% have reduced hours and/or jobs and 47% reported lower than normal turnover. Similarly, there is a continuous flow of information on self-employment from the Annual Population Survey as one of the most vulnerable business groups.
Within this flow of information, relatively less attention has been paid on the spatially heterogeneous nature of the expected impacts. From the 2008 and other crises, we know that national level disturbances affect places in varying ways. From regions (Martin, 2012, Kitsos et al., 2019, Sensier et al., 2016, Rocchetta and Mina, 2019) to cities (Martin and Gardiner, 2019) to local authority districts (Kitsos, 2020, Kitsos and Bishop, 2018) and Travel-to-Work Areas (Lee, 2014), the evidence suggests that places have different resilience capacities to avoid or overcome a crisis. We also have a lot of evidence on the factors affecting resilience performance from the industrial structure (Kitsos et al., 2019, Martin et al., 2016, Rocchetta and Mina, 2019) to labour market (Kitsos and Bishop, 2018, Lee, 2014), institutional (Bristow and Healy, 2013, Simmie and Martin, 2010) and individual characteristics (Doran and Fingleton, 2016).
The COVID-19 economic downturn is hardly expected to be different and initial works from City-REDI as well as the Centre for Cities and Centre for Towns among others have informed the limited discussion on the sub-national variation of the crisis. This blog builds on previous blogs (here and here) to further consider the heterogeneity of the crisis impact and the resilience challenge across different local authority districts.
Starting with the most recent picture of the unemployment-related data, we map below the share of the working-age resident population that is claiming unemployment related benefits (figure 1). The data for February show significant variation (table 1) with the worst performers having more than double the average rate and being 6 to 9 times worse than the best performers. There are several reasons as to why claimant counts may not be an accurate reflection of unemployment (Beatty and Fothergill, 2005) but it is indicative of the range within the country.
Figure 1: Claimant share of the working-age resident population
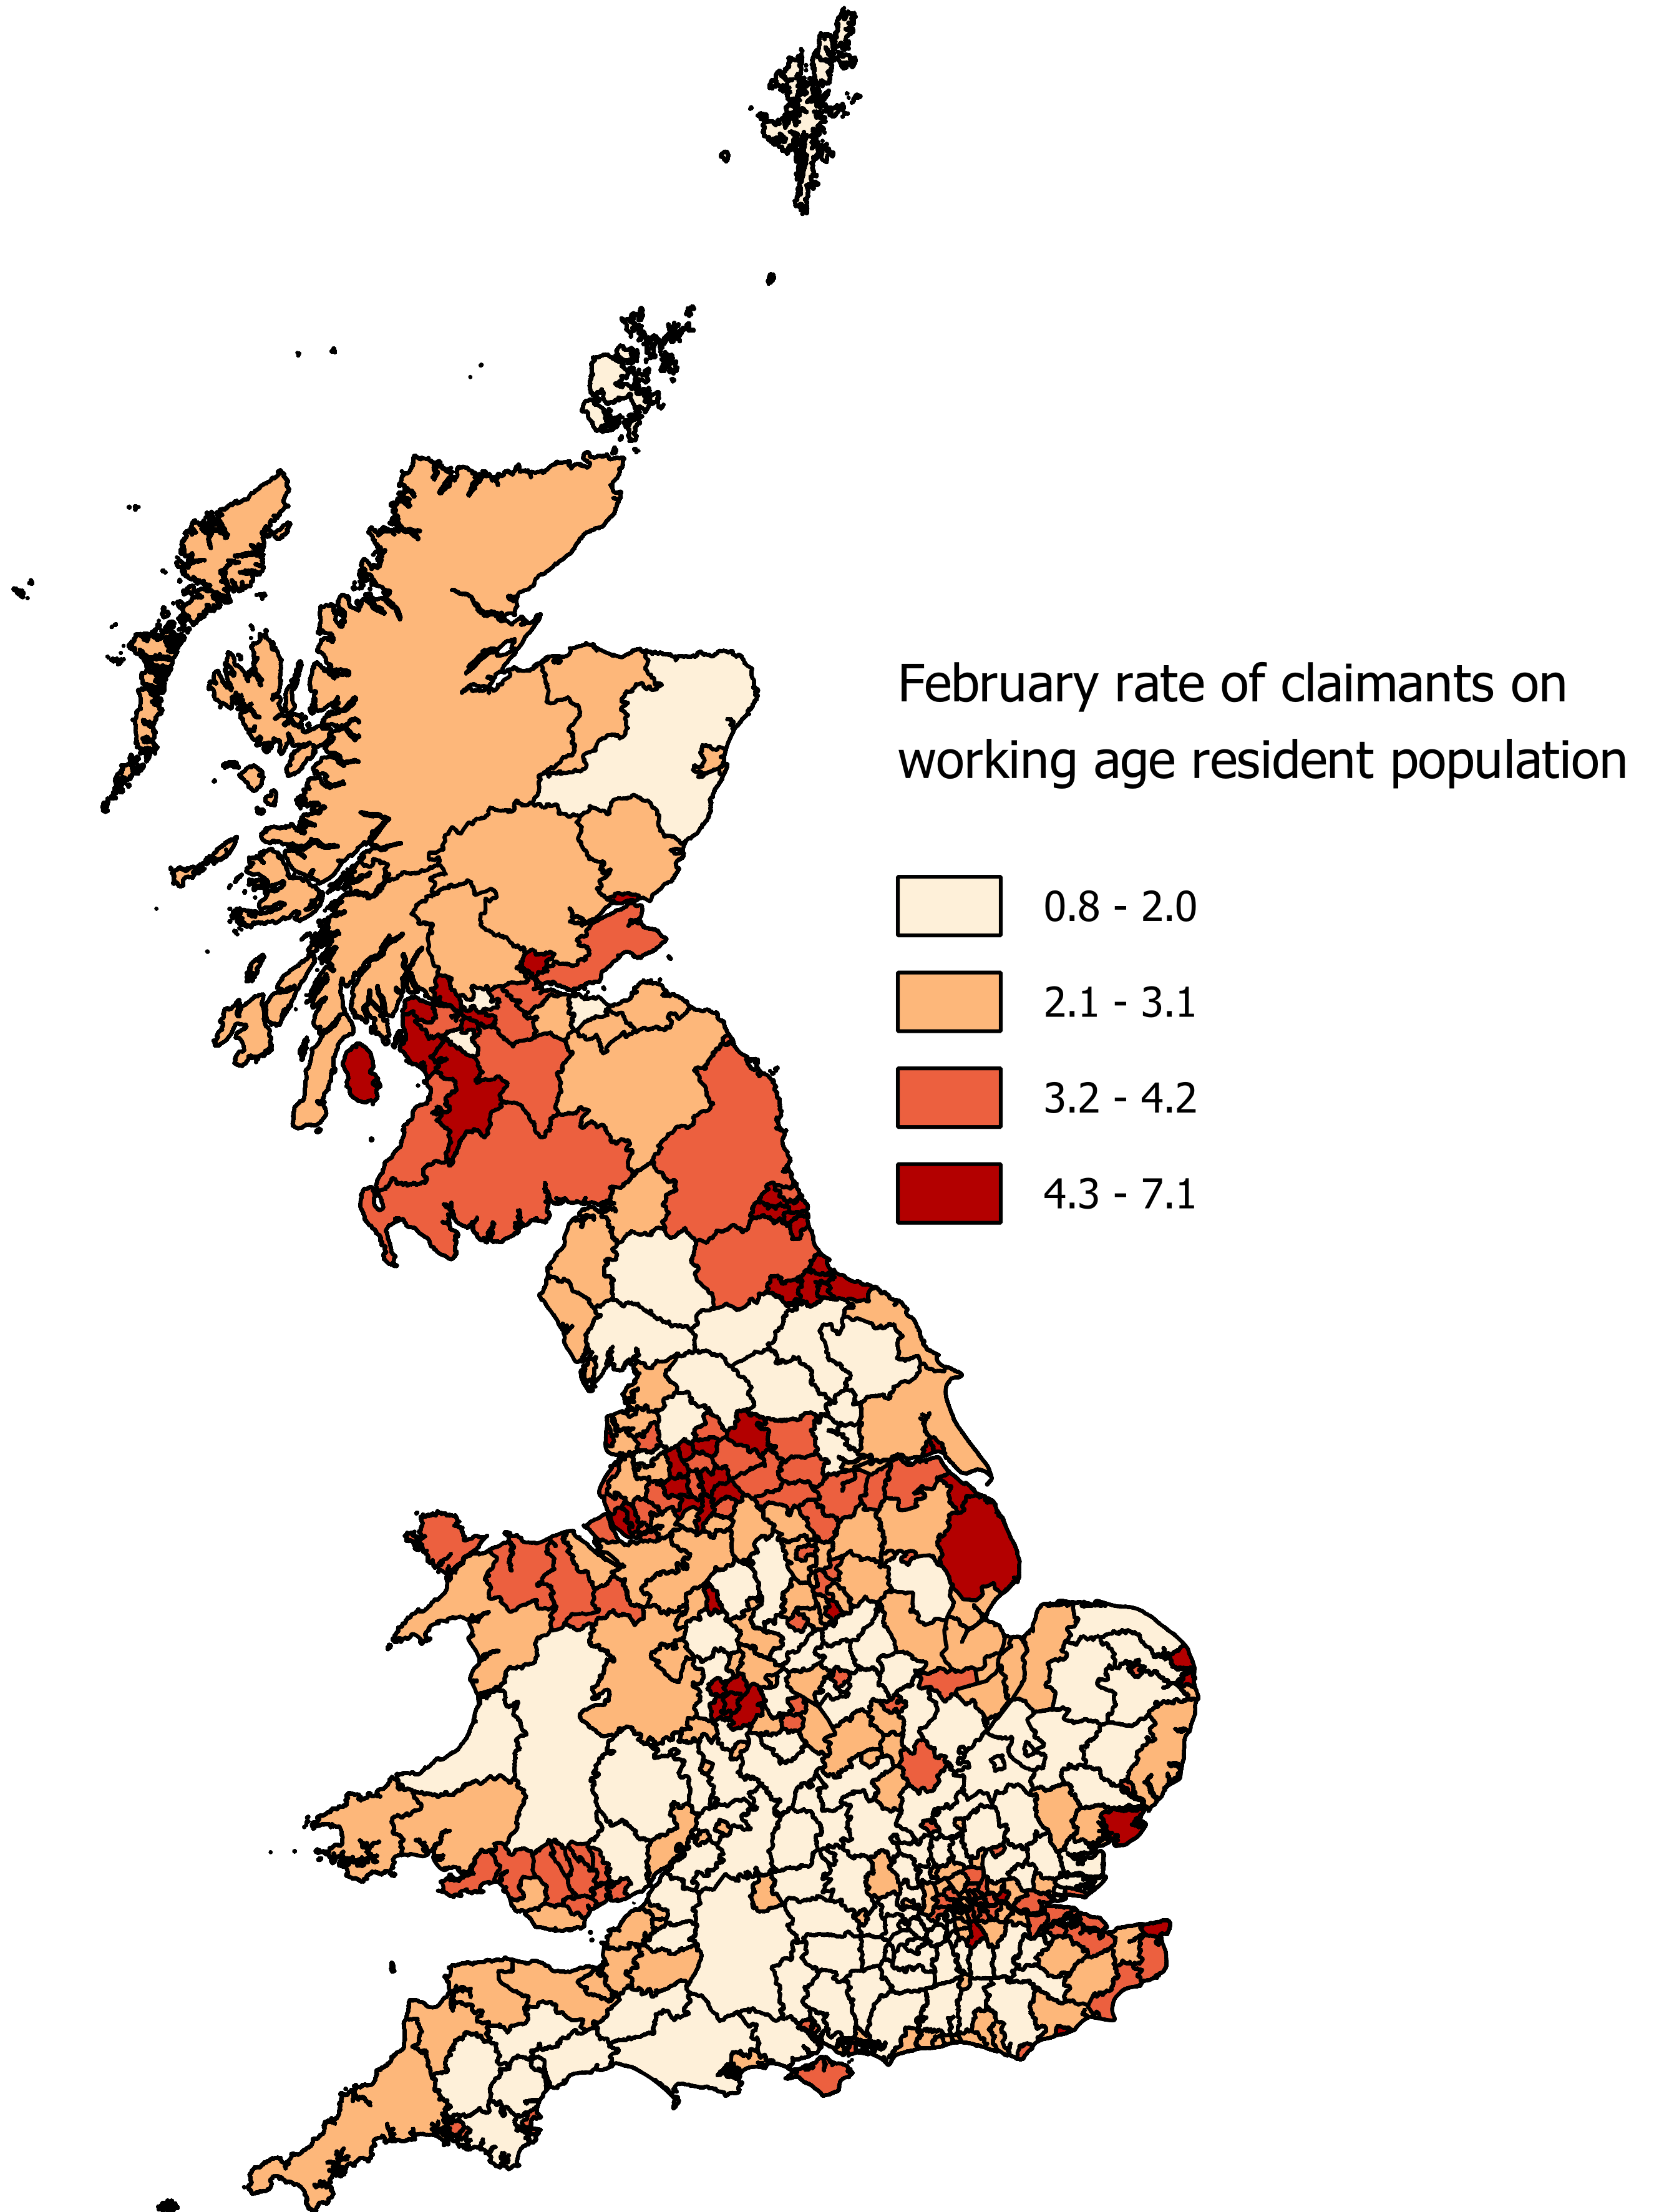
Table 1: Best and worst performers in terms of claimant counts for February 2020
| Local Authority District | February 2020 share of claimants from the working-age resident population | |
| Top-5 performers | Isles of Scilly | 0.8 |
| Hart | 0.9 | |
| South Northamptonshire | 1 | |
| Waverley | 1 | |
| Wokingham | 1.1 | |
| GB average | 3.1 | |
| Bottom-5 performers | Wolverhampton | 6.2 |
| Middlesbrough | 6.2 | |
| South Tyneside | 6.2 | |
| Birmingham | 6.7 | |
| Blackpool | 7.1 | |
| Source: Author’s elaboration of Claimant count data from NOMIS | ||
Focussing on the industries affected by the lockdown can also inform our understanding of the variation of crisis impact and resilience performance to be expected. The industries we examine have been identified by the Institute for Fiscal Studies and include
- Non-food, non-pharmaceutical retail (4719, 4730-4772, 4776-4799);
- Passenger transport (4910, 4931-4939, 5010, 5030, 5110)
- Accommodation and food (5510- 5630)
- Travel (7911-7990); childcare (8510, 8891)
- Arts and Leisure (9001-9329 except ‘artistic creation’ 9003)
- Personal care (9601-9609 except ‘funeral and related activities’ 9603)
- Domestic services (9700)
Looking at the share of employment in these industries we can identify places with significant concentrations of workers that are currently not working (figure 2).
Figure 2: Share of employment in shutdown industries

Tourism and leisure appear to be driving the wide deviations from the mean (Table 2) observed with coastal areas having the highest shares together with some London Boroughs. 45 local authorities have shares of over 23.3% in sectors affected by the lockdown.
Table 2: Highest and lowest share of employment in shutdown industries
| Local Authority District | Share of employment in shutdown industries | |
| Top-5 | City of London | 7 |
| Tower Hamlets | 10.1 | |
| South Cambridgeshire | 10.3 | |
| Fenland | 10.9 | |
| North Warwickshire | 11.3 | |
| GB average | 18.2 | |
| Bottom-5 | East Lindsey | 30.4 |
| Hounslow | 31.6 | |
| Kensington and Chelsea | 33.8 | |
| South Lakeland | 34.3 | |
| Isles of Scilly | 38.8 | |
| Source: Author’s elaboration of BRES data from NOMIS | ||
Finally, we look at the share of businesses that operate in the shutdown industries (figure 3). Again, a similarly wide range is found. The majority of local authorities are below the country average of 19.4 which suggests low concentrations of firms in these industries. However, 28 local authorities are found with more than a quarter of their businesses in sectors currently shut down.
Figure 3: Share of businesses in shutdown industries
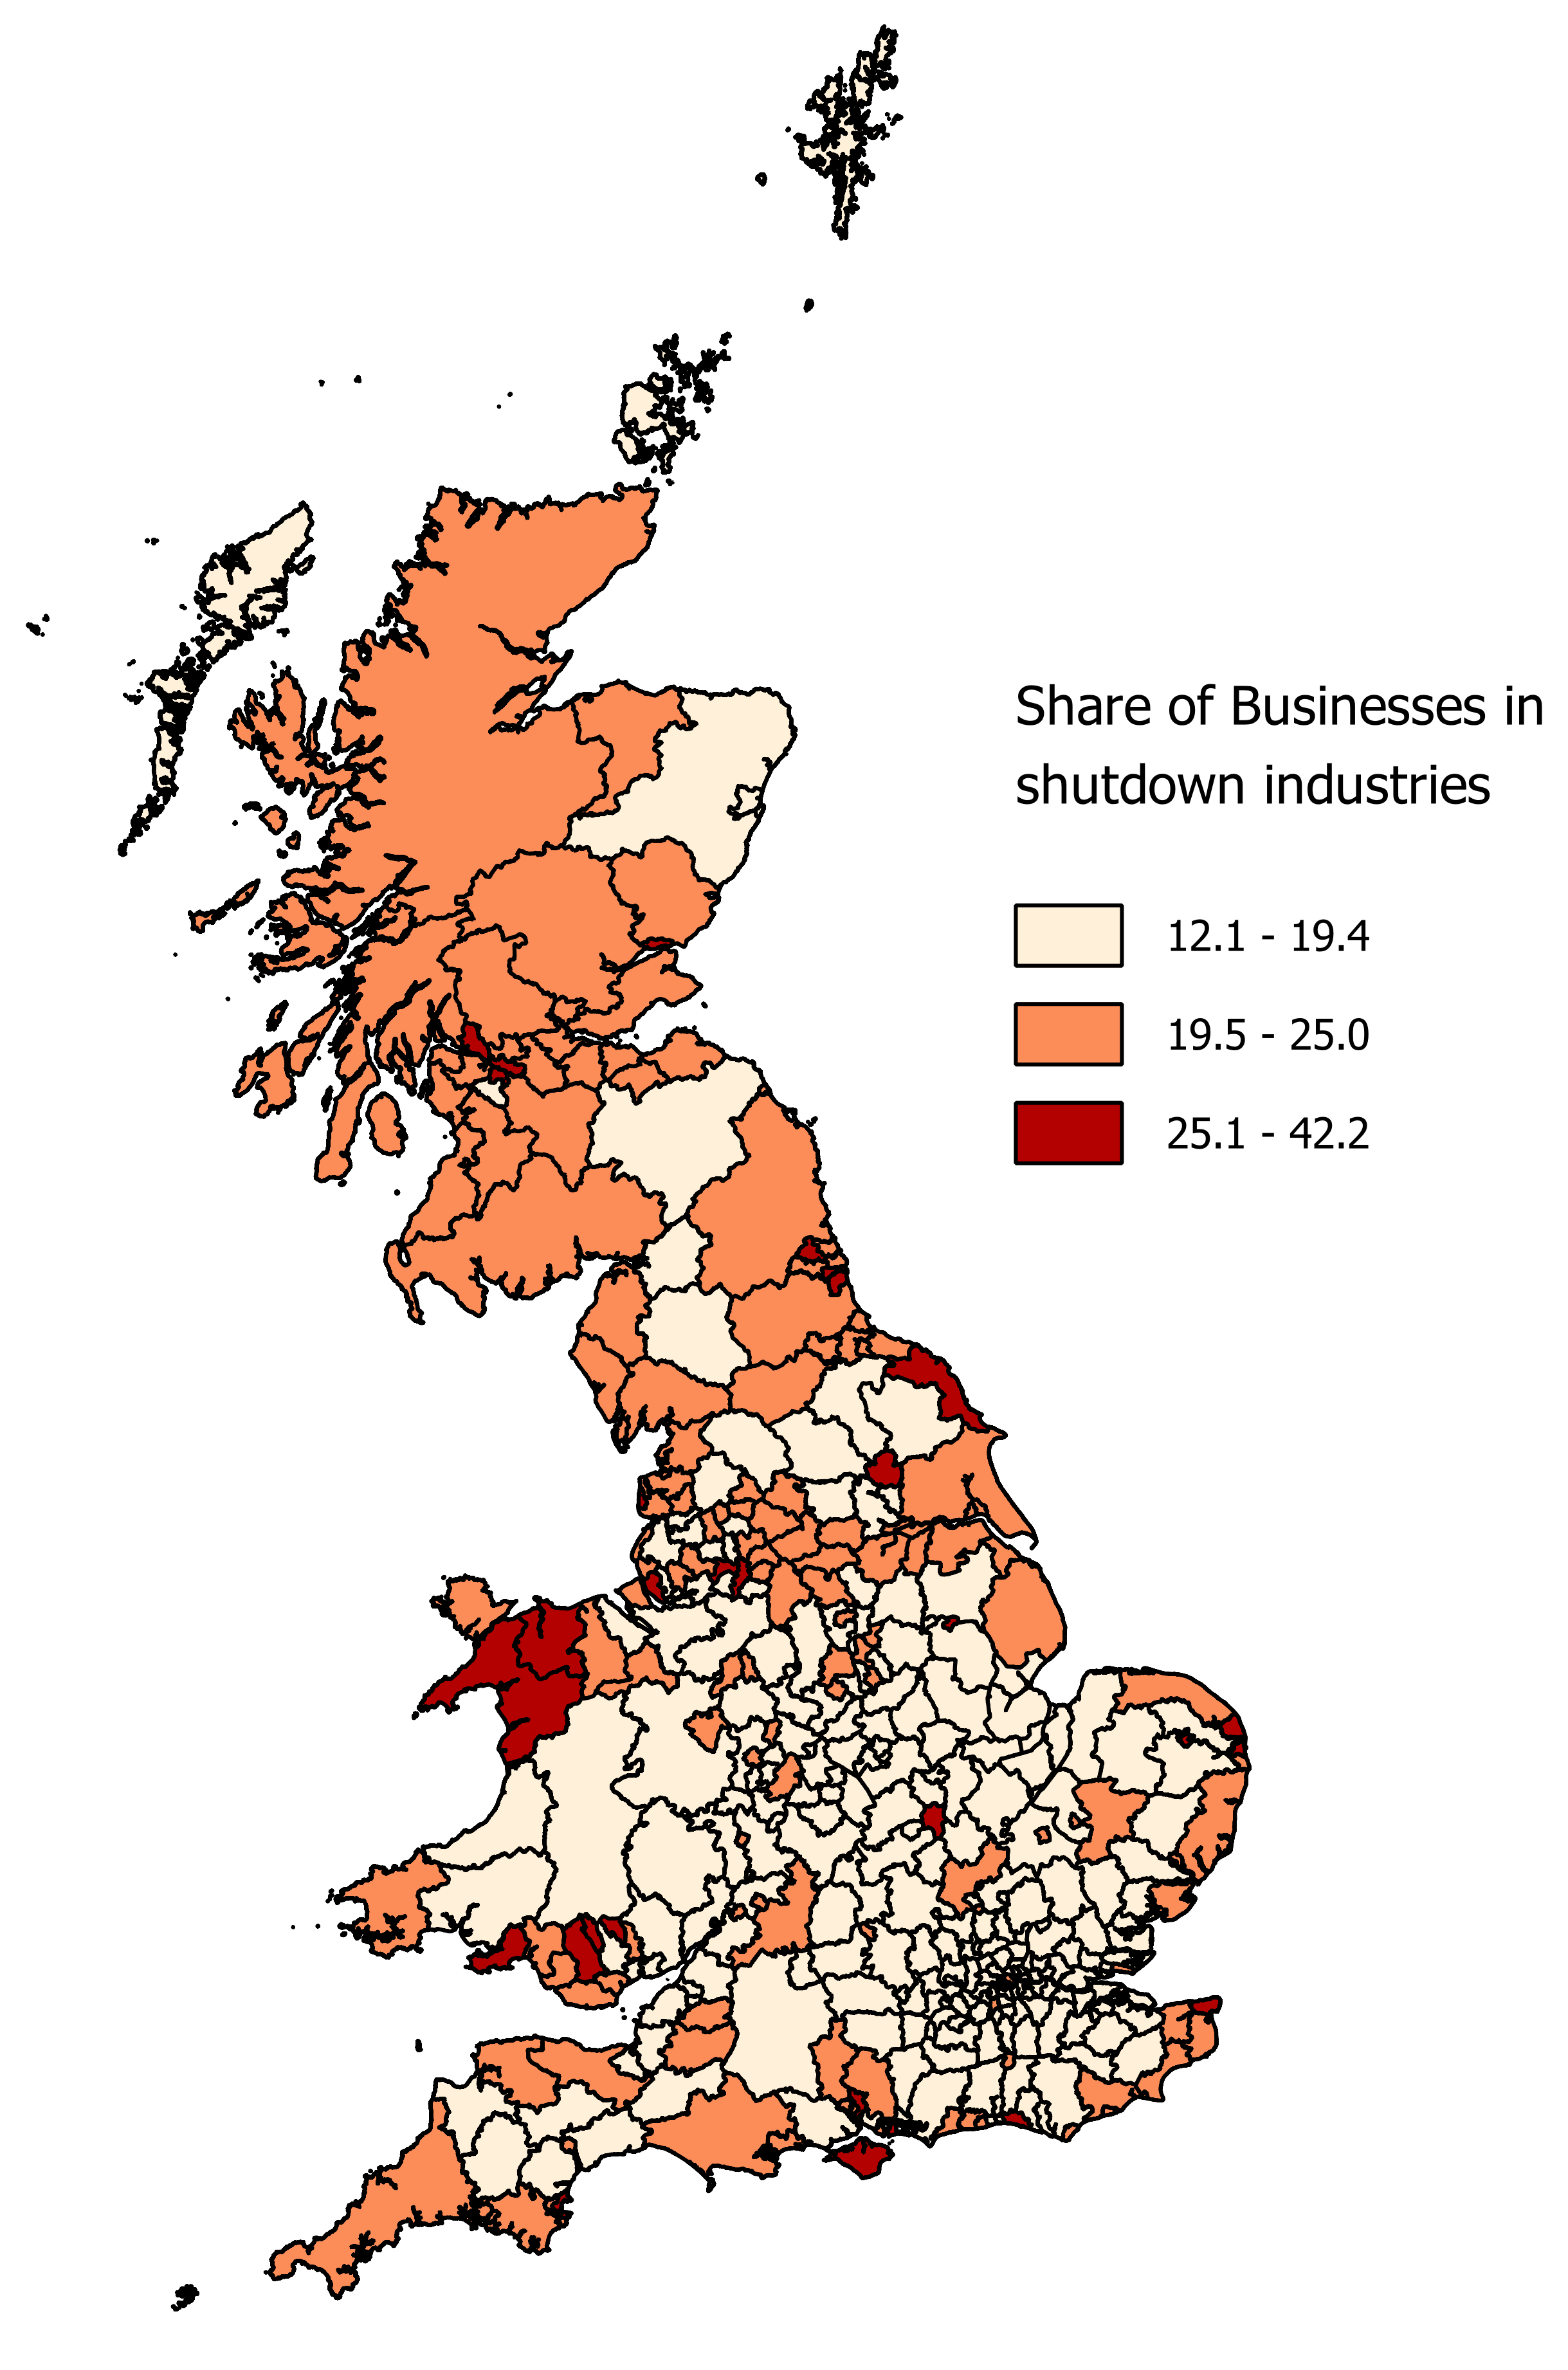
Table 3: Highest and lowest share of businesses in shutdown industries
| Local Authority District | Share of employment in shutdown industries | |
| Top-5 | City of London | 12.1 |
| South Cambridgeshire | 12.2 | |
| Aberdeenshire | 12.4 | |
| Wokingham | 12.8 | |
| Three Rivers | 13.2 | |
| GB average | 19.4 | |
| Bottom-5 | Blackpool | 30.9 |
| Isles of Scilly | 31.1 | |
| Rhondda Cynon Taff | 31.6 | |
| Eastleigh | 36.9 | |
| Wellingborough | 42.2 | |
| Source: Author’s elaboration of Business counts data from NOMIS | ||
The data above highlight two issues. The first is the main topic of the blog. There is significant spatial heterogeneity of the expected crisis impact within the country. Not all places will be affected the same and we know also that not all places are able to respond in the same capacity. Place resilience becomes once again central and the current support measures should take into consideration the spatially different magnitude of the crisis and the capacity of places to respond.
Secondly, it is important to consider the seasonal nature of business in seaside destinations. The data suggests that seaside locations, together with other tourist hotspots around the country will be severely challenged. The current lockdown is likely to exacerbate the negative economic impacts in these places since a complete relaxation of the current measures is unlikely before the tourist season is well underway.
A limitation of the above discussion is that it focusses only on the current direct impacts of the lockdown in the UK without any consideration of demand slowdown, constraints in manufacturing production and indirect effects in the supply chain (negative and positive, see here for more info). As the recession unravels, the ripple effects will be becoming clearer. On a positive note though, this time (compared to 2008) we know how to better support places and businesses and we have an opportunity to shorten the length of the recession. Before all this though, we need to stay in and stay healthy.
References
BEATTY, C. & FOTHERGILL, S. 2005. The diversion from ‘unemployment’ to ‘sickness’ across British regions and districts. Regional Studies, 39, 837-854.
BRISTOW, G. & HEALY, A. 2013. Regional Resilience: An Agency Perspective. Regional Studies, 48, 923-935.
DORAN, J. & FINGLETON, B. 2016. Employment Resilience in Europe and the 2008 Economic Crisis: Insights from Micro-Level Data. Regional Studies, 50, 644-656.
KITSOS, A. 2020. Economic resilience in Great Britain: an empirical analysis at the local authority district level. In: BRISTOW, G. & HEALY, A. (eds.) Handbook on Regional Economic Resilience. Cheltenham: Edward Elgar.
KITSOS, A. & BISHOP, P. 2018. Economic resilience in Great Britain: the crisis impact and its determining factors for local authority districts. The Annals of Regional Science, 60, 329-347.
KITSOS, A., CARRASCAL-INCERA, A. & ORTEGA-ARGILÉS, R. 2019. The Role of Embeddedness on Regional Economic Resilience: Evidence from the UK. Sustainability, 11.
LEE, N. 2014. Grim down South? The Determinants of Unemployment Increases in British Cities in the 2008–2009 Recession. Regional Studies, 48, 1761-1778.
MARTIN, R. 2012. Regional economic resilience, hysteresis and recessionary shocks. Journal of Economic Geography, 12, 1-32.
MARTIN, R. & GARDINER, B. 2019. The resilience of cities to economic shocks: A tale of four recessions (and the challenge of Brexit). Papers in Regional Science, 1-32.
MARTIN, R., SUNLEY, P., GARDINER, B. & TYLER, P. 2016. How Regions React to Recessions: Resilience and the Role of Economic Structure. Regional Studies, 50, 561-585.
ROCCHETTA, S. & MINA, A. 2019. Technological coherence and the adaptive resilience of regional economies. Regional Studies, 1-14.
SENSIER, M., BRISTOW, G. & HEALY, A. 2016. Measuring Regional Economic Resilience across Europe: Operationalizing a complex concept. Spatial Economic Analysis, 11, 128-151.
SIMMIE, J. & MARTIN, R. 2010. The economic resilience of regions: towards an evolutionary approach. Cambridge Journal of Regions, Economy and Society, 3, 27-43.
This blog was written by Dr Tasos Kitsos, Research Fellow, City-REDI / WM REDI, University of Birmingham.
To sign up for our blog mailing list, please click here.
Disclaimer:
The views expressed in this analysis post are those of the authors and not necessarily those of City-REDI or the University of Birmingham