
Kelvin Humphreys and colleagues use World Intellectual Property Organisation’s (WIPO) annual Global Innovation Index to assess how innovative the West Midlands is.

This is part of a series of blogs looking at Innovation in the West Midlands.

Find out more about our work on regional innovation systems.
Summary
This analysis compares the innovation performance of the Birmingham city-region with counterparts in the UK and abroad. Although it is reliant on a limited set of science and technology (S&T) output indicators as proxies for innovation, it reveals some novel differences.
- Manchester and Birmingham city-regions both underperform relative to their international peer group based on population size.
- Oxford and Cambridge are national and global outliers in terms of S&T intensity. Disregarding these outliers, there is relatively little variation in innovation performance across regions, compared to other countries.
- Breaking down the analysis to focus on specific measures of S&T output and discounting the outliers shows the West Midlands to be performing well nationally, relative to its size, while Greater Manchester lags the rest of the pack, especially on patent applications.
Benchmarking the innovation performance of the West Midlands region
Our aim is to benchmark the innovation performance of the West Midlands region (aligning with the International Territorial Level 2 (ITL2) definition of the metropolitan county) within both the national and international context. The West Midlands is the largest urban agglomeration outside of London and has been noted for its relatively high level of private sector investment in R&D, but low level of public sector investment in R&D. This analysis attempts to benchmark regional performance using patenting and scientific publication data by drawing on methodology and metrics published in the World Intellectual Property Organisation’s (WIPO) annual Global Innovation Index.
WIPO provides an annual ranking of the Top 100 Science and Technology Clusters worldwide based on a bottom-up analysis that uses geolocated patent and scientific publications data as a proxy for science and technology (S&T) intensity. Clusters are identified according to the density and proximity of geolocated data and do not necessarily align with established municipal boundaries. S&T intensity is defined as a cluster’s combined global patent and publication output per 1 million people. WIPO’s method maps identified clusters onto population data from the Global Human Settlement Layer Population Grid thereby creating a high-resolution view of clusters and their S&T intensity.
WIPO’s Top 100 rankings for 2020 (S&T cluster rankings are taken from WIPO’s Global Innovation Index 2020. The analysis uses patent and publications data between 2014-2018 and population data from 2015. The 2021 Index was not used as it contains a more limited set of data.) show an inverse relationship between cluster size and S&T intensity with small but highly intensive clusters, including Oxford and Cambridge, at one end and large but relatively lower intensity clusters, including London, at the other end. Manchester is the only other UK city that appears in the 2020 rankings.
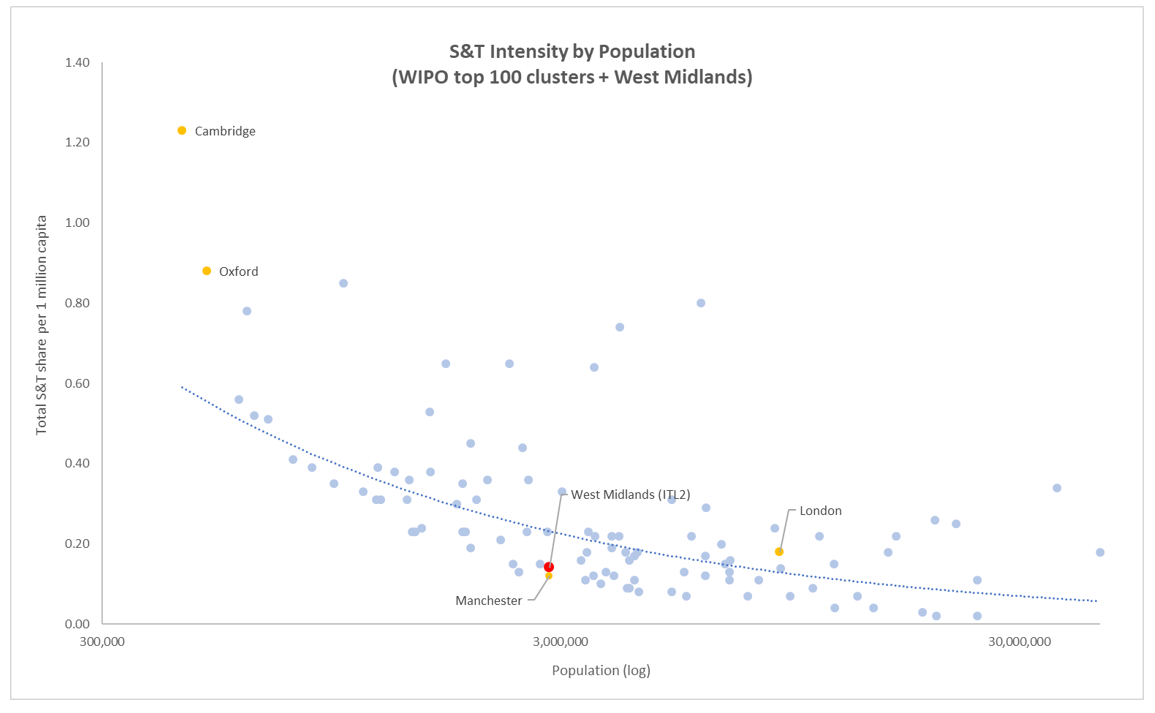
We have attempted to benchmark the West Midlands against WIPO’s rankings using a simplified methodology. To do this we took the patent, scientific publication and population data falling within the West Midlands metropolitan county (ITL2) administrative boundaries and used it to calculate S&T intensity per capita. Whilst the methodology is less granular the results yield an interesting insight as the region places in an almost identical position to Manchester. In this case, Manchester refers to the innovation cluster identified in WIPO’s bottom-up analysis rather than a particular administrative geography. The identified population of 2.84 million people aligns very closely with that of the metropolitan county.
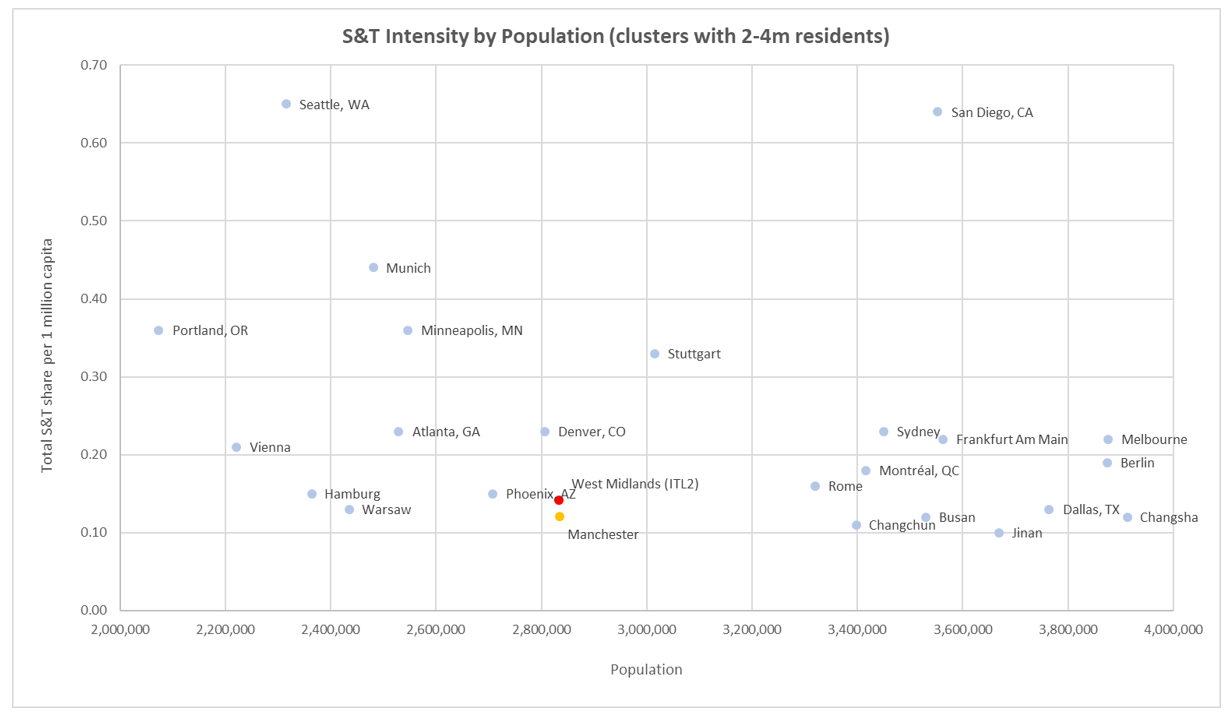
The West Midlands region has a population of c. 2.8m people. Focusing in on the S&T intensity of clusters with a population between two and four million highlights that both UK cities underperform compared to their peer group based on size.
Benchmarking analysis for the major economic regions in the UK
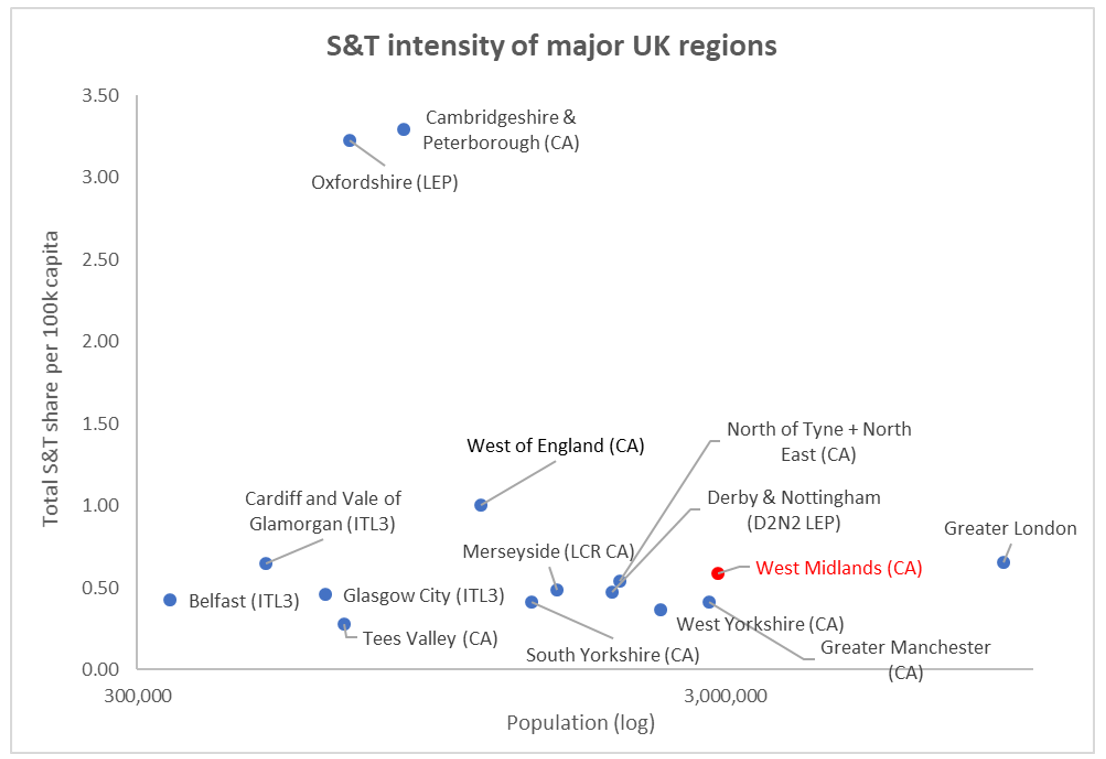
Our next step was to perform a similar benchmarking analysis for the major economic regions in the UK, including all combined authorities and core cities. We achieved this using available patents, scientific publications and population data for the most recent five-year period (Patent data is taken from the OECD REGPAT database and suffers from a time lag meaning the most recent data covers 2013-2017. Scientific publications data is available for 2017-2021 using the Web of Science, Science Citation Index Expanded (SCIE) excluding Arts & Humanities and Social Sciences research areas). Population estimates are averaged over 2016-2020. We defined geographies outside of Greater London using combined authority boundaries, Local Enterprise Partnership boundaries (England only) or corresponding ITL3 boundaries as applicable.
Charting S&T intensity against population demonstrates a less clear relationship between intensity and size within the UK. Oxfordshire (LEP) and Cambridgeshire and Peterborough (Combined Authority) appear to be complete outliers.
Switching the axis to plot patent applications and scientific publications per (100k) capita demonstrates just how intensive Oxfordshire and Cambridgeshire are for both proxy measures relative to all other UK major economic regions. There is also a more discernible relationship between patents and publications with performance across both measures appearing to closely correlate.
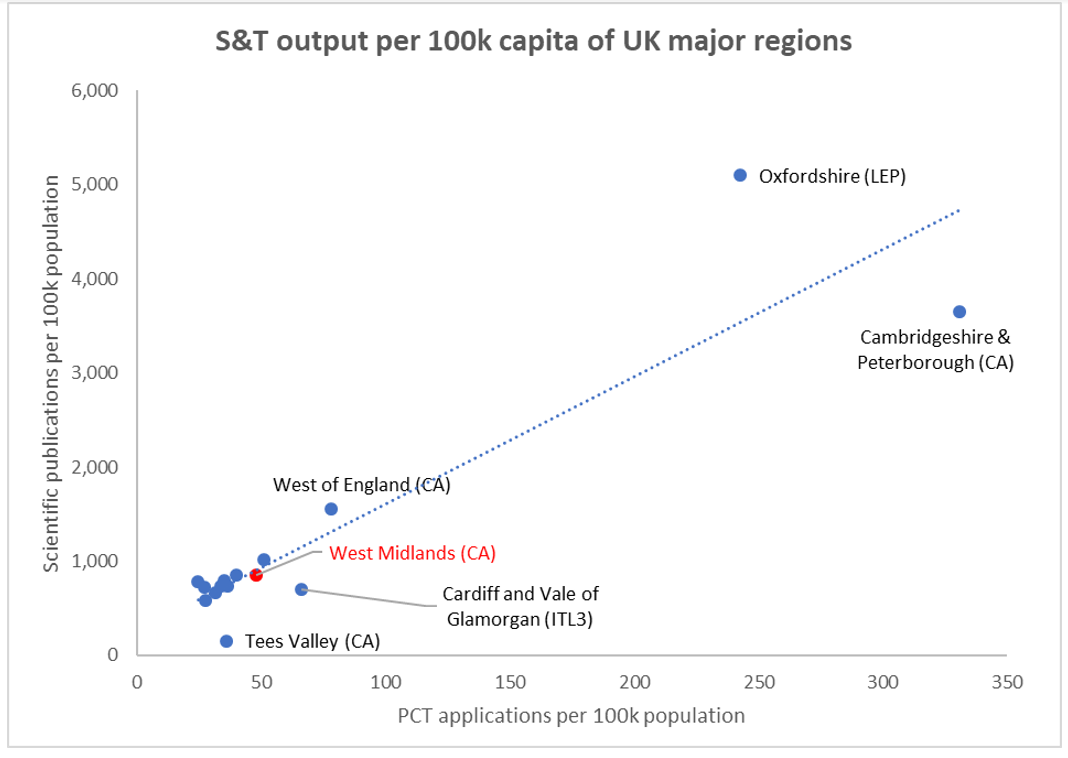
Excluding the outliers and focusing on the remaining regions shows the West Midlands to be performing relatively well amongst major UK regions and not too dissimilar to Greater London.
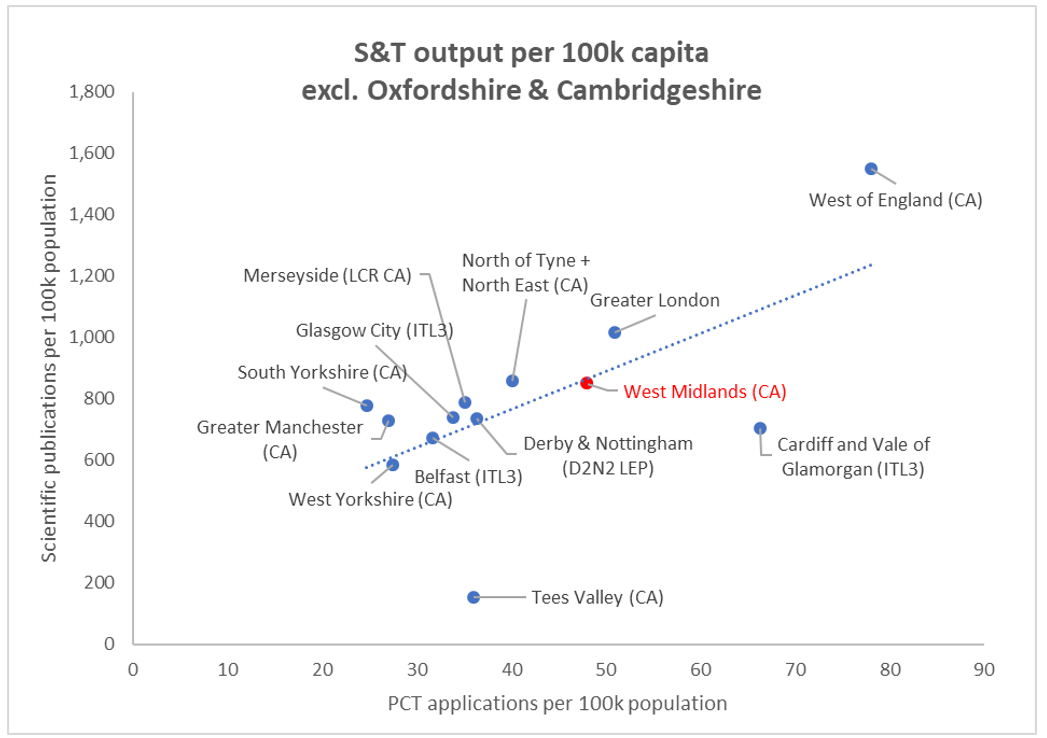
The West Midlands is therefore performing well within the national context relative to its size when using these two proxy measures for S&T output. Interestingly, Greater Manchester lags the rest of the pack when using our simplified methodology, especially on patent applications. Both city-regions underperform their international peer group of similarly sized S&T clusters based on the WIPO rankings.
Innovation weakness of the UK
It could be said that the UK as a whole has an apparent weakness relative to other highly innovative nations (the UK ranked 4th in WIPO’s Global Innovation Index 2021 in comparison to 131 other nations) when it comes to mid-sized cities. Between the stellar S&T performance of Oxford and Cambridge and the global significance of London, there is little in between that could be classed as world-leading. Compared to other countries, including the US, there is remarkably little variation in innovation performance across regions, not considering the two outliers.
Raising the innovation potential of regional cities outside the London-Oxford-Cambridge ‘Golden Triangle’ could accelerate economic growth outside of the Greater South East and help to address inter-regional inequality. The Levelling Up White Paper aims to achieve this through a spatial rebalancing of R&D investment although current spending commitments do not go far enough.
Whilst the results of this exercise paint an unsurprising picture it should be noted that the use of patents and scientific publications as proxies for innovation performance is overly simplistic. A more comprehensive attempt could be made to link innovation inputs (which include scientific outputs) with innovation outputs, including commercialisation and adoption of new technologies for economic exploitation.
This blog is written by Kelvin Humphreys, Dr Carolin Ioramashvili, Professor Simon Collinson, Hannes Read and Dr Fengjie Pan, City-REDI / WMREDI, University of Birmingham.
Disclaimer:
The views expressed in this analysis post are those of the authors and not necessarily those of City-REDI / WMREDI or the University of Birmingham.